Single-walled carbon nanotubes (SWNTs) are a mixture of tubes of different chiralities, some of which are electrically conducting and some are semiconducting (see structure of Carbon Nanotubes). It is desirable, for many applications, to isolate the types of nanotubes from one another, such as metallic from semiconducting, and for some applications, tubes with well-defined individual chiralities.
Overview
Laboratory scale methods designed to achieve a very high degree of selectivity have been reported, and efforts to develop scalable processes are underway. In particular, manufacturing processes such as the CoMoCAT catalytic CVD process have been shown to provide a substantial degree of selectivity toward certain chiralities in as-synthesized SWNTs, making the yield of secondary purification processes substantially higher. Chiral SWNTs are available in research quantities through Aldrich Materials Science in collaboration with SouthWest Nanotechnologies (SWeNT). These are presented in Table 1.
|
Aldrich Product #
|
SWeNT # |
Chirality |
Purity |
|
704148
|
SG 65 |
>50% (6,5) |
>77% (carbon as SWNT) |
|
704121
|
SG 76 |
>50% (7,6) |
>77% (carbon as SWNT) |
Structure of Carbon Nanotubes
Single walled carbon nanotubes (SWNTs) are an allotrope of sp hybridized carbon, similar to fullerenes. The structure can be thought of as a cylindrical tube comprised of 6-membered carbon rings, as in graphene. The cylindrical tubes may have one or both ends capped with a hemisphere of the buckyball or fullerene structure.
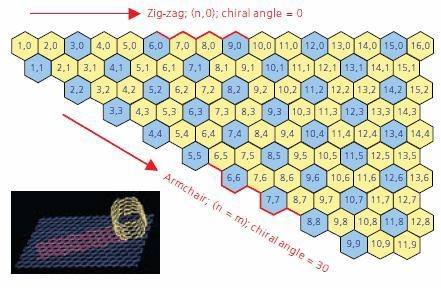
An understanding of SWNT structure requires familiarity with the concept of nanotube chirality, since the chirality of a SWNT dictates many of its properties. A concept known as a Chirality Map, illustrated in Figure 1, has been developed as a tool for understanding chirality and its implications.

Figure 1. A graphic displaying a Chirality Map which shows the various types of SWNTs that can be formed. The properties are governed by the way in which they are rolled as shown in the insert. The SWNT will be metallic in the armchair configuration, or when m-n is a multiple of 3.
A SWNT can be envisioned as a sheet of graphite one atom thick rolled into a tube (see inset in Figure 1). The chirality describes both the orientation and diameter to which the sheet is rolled. Each SWNT on the chirality map is defined by two integers, (n,m). As indicated previously chirality defines many of the properties of the individual SWNT. For example, SWNT shown on the chirality map in blue are metallic in nature. These are tubes where n=m (armchair) or n - m = 3i, (where i is any integer.) Those depicted in yellow are semiconducting, displaying different band gaps depending on the length of the chiral vector.
Analysis by Optical Absorbance Spectroscopy
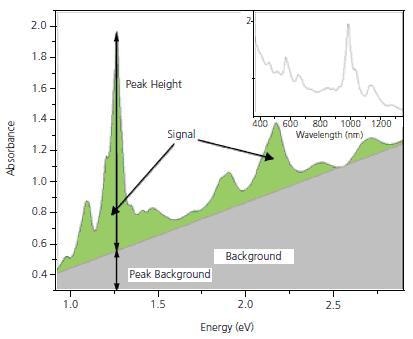
Optical absorption (OA) measurements in the UV-Vis.-NIR region show peaks which are characteristic of individual (n,m) species superimposed on the p-plasmon background. For example, the (6,5) species absorb at 566 and 976 nm and in response fluoresce at 983 nm. A (7,6) SWNT absorbs at 645 and 1024 nm and fluoresces in response at 1030 nm. These individual peaks have been used as a basis for estimating the purity of SWNT. Nair et. al. have developed a method for computing the baseline for the spectrum, which then enables a calculation of peak heights and areas for the individual (n,m) species. For simplicity, we usually transform the measured OA spectrum to the energy domain, where the background becomes linear in the area of interest for SWNT characterization. Figure 2 shows a typical OA spectrum for SG 65. The inset shows the spectrum in the more conventional form with the absorption plotted as a function of wavelength, while Figure 2b shows the same spectrum converted to the energy domain. Measurements of the height of the strongest peak, (P2B) and integration of the overall signal, S2B can be used to ensure that the product is consistent. SWeNT primarily uses P2B as a control parameter for SG 65 and SG 76 nanotubes where one particular tube type is dominant. P2B is defined as the height of the highest peak in the spectrum between 350 and 1,350 nm divided by the background at that wavelength
P2B = (Height of (6,5) or (7,6) Signal Peak)/(Height of Background Peak)

Figure 2. Optical Absorbance spectrum for SG 65. The highest peak corresponds to the (6,5) tubes.
Conclusion
It should be noted that the optical absorption methodology as described here uses the OA spectrum measured after dispersing and centrifuging the SWNT sample. It is used as a measure of chirality control rather than overall purity. Measurement of the absorbance at a particular wavelength before and after centrifugation gives a measure of the dispersability of the SWNTs.

This information has been sourced, reviewed and adapted from materials provided by Sigma Aldrich.
For more information on this source, please visit Sigma Aldrich.