Nanoparticles are gaining interest as a key class of materials in a myriad of applications in electronics, cosmetics, food, pigments, coatings, catalysis and medical industries. Particle morphology, such as particle size, greatly influences their physical and chemical properties.
Nanoparticles have manufacturing challenges and may only be produced in small amounts. Hence, small sample volumes and sample recoverability for further testing are desirable when performing particle size measurements of nanoparticles. These requirements can be met with the Hydro SV accessory, which is a wet dispersion unit consisting of a 7 ml cuvette with magnetic stirrer that facilitates sample recovery.
Significance of Nanoparticle Size
The high surface area of nanoparticles has a direct relationship with their small particle size, and is the key to their unusual properties. Controlling the shape and size of nanoparticles enables fine-tuning of their properties, such as permittivity, conductivity, magnetism, optical properties, surface chemistry and reactivity.
There are many different techniques available to perform nanoparticle size measurements. The large and dynamic range of laser diffraction allows for the analysis of nanoparticles and much larger particles in a single measurement using the same equipment. This would be helpful in cases requiring more flexibility in the lab, such as characterizing nanoparticles mixed with bulk powders in the fine chemical industry, or when monitoring the milling and dispersion of the nanoparticles.
Nanoparticle Measurement Using Hydro SV
Ensuring the resolution and accuracy of the results is a major challenge in nanoparticle measurement by means of laser diffraction. Precision represents a function of repeatability and resolution is defined as the ability to extract data from similar sized samples.
This experiment involved measuring two nanoparticulate ink samples to illustrate the precision and resolution of the laser diffraction measurement. The characterization of these samples using dynamic light scattering (DLS) revealed that they had median sizes roughly 20 nm apart with overlapping particle size distributions. The laser diffraction measurements of the same samples were then carried out using the Mastersizer 3000 and Hydro SV dispersion unit.
Experimental Results and Discussion
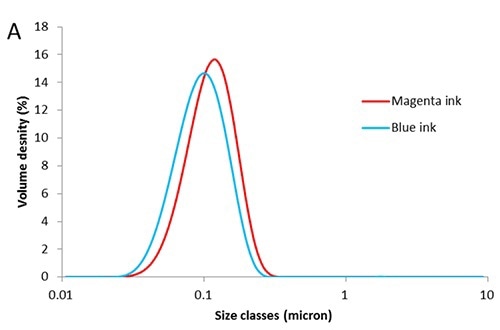
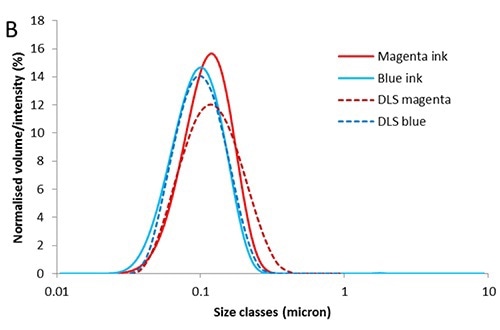
Figure 1A reveals that the particle size distributions of the magenta and blue inks are largely Gaussian and have a small tail of fines. The median values are clearly resolved, despite overlapping of the particle size distributions. DLS was also used to measure particle size distributions to corroborate the size difference between the two samples. Figure 1B shows comparison of the particle size distribution measurements of the samples taken both techniques.


Figure 1. Particle size distributions, PSD, for magenta and blue inks measured by (A) laser diffraction and (B) in comparison to dynamic light scattering.
Table 1. summarizes the percentiles of the distributions. The results show overlapping of the size distributions for the blue ink with good agreement between the Dv10, Dv50 and Dv90. There is good agreement between the size distributions for the magenta ink, though DLS measures a slightly larger value for Dv90. This may be due to the fact that the two techniques have different sensitivities.
Table 1. PSD percentiles for the magenta and blue inks measured by laser diffraction and DLS.
| A |
Dv (10) (µm) |
Dv (50) (µm) |
Dv (90) (µm) |
| Diffraction |
DLS |
Diffraction |
DLS |
Diffraction |
DLS |
| Magenta |
0.067 |
0.065 |
0.113 |
0.118 |
0.179 |
0.217 |
| Blue |
0.055 |
0.059 |
0.096 |
0.099 |
0.157 |
0.166 |
The precision of the measurements also needs to be assessed. The forces of adhesion between the particles increase with decreasing particle size. Hence, the state and stability of dispersion of a sample of nanoparticles play key role in obtaining accurate particle size results. The dispersion stability can be assessed by performing several measurements of each sample.
Table 2. summarizes the PSD percentiles for five repeat particle size measurements of the magenta sample, and the deviation (%RSD) of these measurements. This deviation is inside the acceptable repeatability limits defined in the ISO standard for laser diffraction of 3% on the Dv50 and 5% on the Dv10 and Dv90.
Table 2. Repeatability data for the magenta ink.
| B |
Dv (10) (µm) ISO 5% |
Dv (50) (µim) ISO 3% |
Dv (90) (µm) ISO 5% |
| Magenta 01 |
0.0665 |
0.113 |
0.179 |
| Magenta 02 |
0.0671 |
0.113 |
0.178 |
| Magenta 03 |
0.0665 |
0.113 |
0.179 |
| Magenta 04 |
0.0651 |
0.112 |
0.180 |
| Magenta 05 |
0.0679 |
0.113 |
0.178 |
| Mean |
0.0666 |
0.113 |
0.179 |
| 1xStd Dev |
0.00104 |
0.00040 |
0.00090 |
| 1RSD(%) |
1.56 |
0.318 |
0.501 |
Conclusion
The Mastersizer 3000 and Hydro SV dispersion unit were used to perform laser diffraction measurements of two nanoparticle samples with Dv (50) values only 20 nm apart. The acquired values were in good agreement with the values acquired by DLS, demonstrating the advantage of using the Mastersizer 3000 and Hydro SV to acquire accurate and precise nanoparticle size measurements. As a result, the material properties of the nanoparticles can be controlled.

This information has been sourced, reviewed and adapted from materials provided by Malvern Panalytical.
For more information please visit Malvern Panalytical.