Single-wall carbon nanotubes (SWCNTs) are known to impart exceptional thermal, mechanical, and electrical properties when applied in a polymer matrix. The large surface areas and highly conductive property of SWCNTs are used to prepare conductive polymer films and blends, super capacitors, and enhanced lithium ion batteries. Innovative optical properties enable their use as electrodes in solar cells, display, and emerging solid state lighting technologies.
Certain SWCNT species have a semiconducting nature, which permits their adjustment to sensors, logic devices, security tags, and non-volatile memory elements. The numerous techniques of fabricating SWCNT materials generate a blend of carbon allotropes and other production products. Thermogravimetric analysis (TGA) has been identified as a practical tool to distinguish these mixtures, through the testing of the weight loss of the sample as it is heated at 5°C/minute in atmospheric air.
This article shows how the Pyris™ 1 TGA is used to operate one such SWCNT production batch based on the ISO/TS protocol 11308:2011-(E) (Figure 1). This procedure was applied, however all of the steps sited are not covered here.
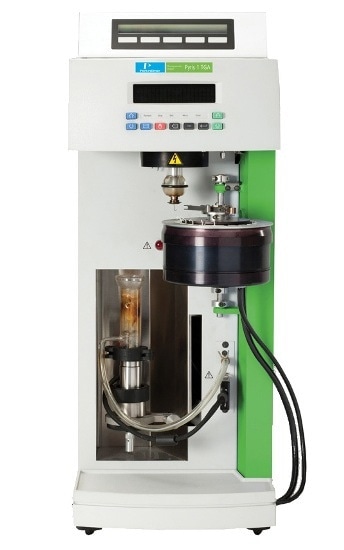
Figure 1. Pyris 1 TGA
The Analyzer
The balance purge inputs as well as the sample were linked to a tank of high purity, dry bottled air leading to a purge rate of about 80 cc/minute, which is considered optimum with regard to the criteria offered in the protocol. The hang down wire was chosen as nichrome and supports the sample pan in the furnace, offering excellent gravimetric performance under test conditions.
Using tiny pieces of nickel, pure alumel, iron and perkalloy, the TGA was temperature calibrated within two degrees. The Curie points of these metals are spotted at distinct temperatures in the presence of a magnetic field as the samples are heated at 5°C/minute in atmospheric air.
Sample Preparation
The sample tested was 'As Prepared' SWCNTs from Carbon Solutions, featuring a high surface area, black, fluffy material made up of a variety of shape and size 'particles'. A slight draft was adequate to set the particles airborne.
The initial test was to obtain an adequate quantity of sample— given as a minimum of 3 mg—in a TGA sample pan. Although both the platinum and ceramic autosampler compatible pans were acceptable and provided similar results, it was observed that the platinum pans were easier to load and compress the sample moderately without getting any material on the external side of the pan.
The pan was tared both in the PerkinElmer AD6 Microbalance and in the TGA defore loading the SWCNT material. Sample material was loaded through a small funnel (Figure 2) designed by cutting the tip and most of the barrel off of a plastic syringe. The tip’s outer diameter was correlated to the pan’s inner diameter. A stainless steel rod was utilized to press the sample via the funnel tip and for compacting it slightly.
While loading the sample material, the platinum bale of the platinum pan was provisionally bent to the side. This cannot be done with the ceramic capsules. When an auto sampler is not available, the loaded pan was manually placed on the hang down wire of the TGA, the system equilibrated, the furnace temperature raised to 20°C, and the sample weight finally entered. Moisture loss at the microgram level was obvious as the sample was equilibrated in the dry purge.
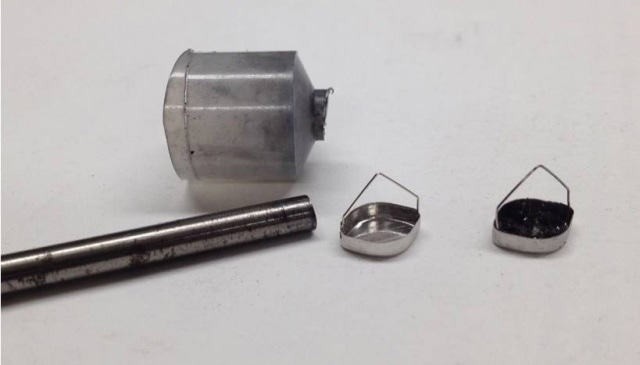
Figure 2. Funnel, tamper, empty pan, and run sample.
The Temperature Program and Baseline
The heating ramp was initiated at laboratory temperature and operated to an upper temperature of 900°C. Since there was a quantifiable rate of weight loss at this temperature when operating a SWCNT sample, an isotherm was applied at 900°C temperature to enable the samples, which slightly differ in mass and compaction, to accomplish a weight loss of more reproducible equilibrium.
Figure 3 shows a representative sample and baseline run, with time as the X-axis. It can be observed that the dwell time at 900°C is followed by a quick cool down to room temperature with the furnace maintained at same position around the sample. This makes it possible to establish the sample weight following analysis under the same conditions as it was initially weighed. Along with the four samples, four empty pan baselines were also run to obtain an average baseline correction and measure of uncertainty.
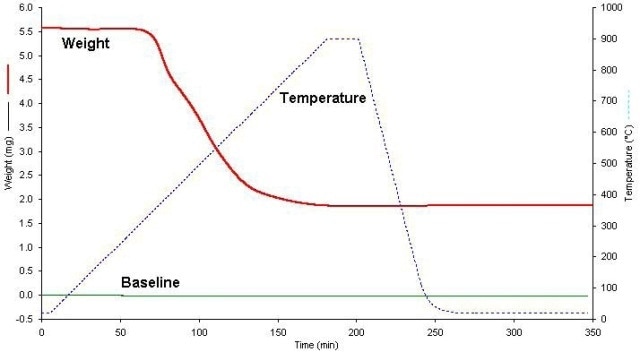
Figure 3. Sample run showing T-Program.
Calculations
The sample’s weight is established approximately 1 minute following loading. The air-oxidized remainder’s weight is determined following 10 minutes at 900°C, and the weight is once again estimated after cooling to the initial temperature. Related measurements were performed on the empty pan baselines, excluding that at the end of the minute at the starting temperature the weight is zeroed.
According to the protocol, any weight loss over 120°C is also determined, as this is accounted as a side reaction, for instance, oxidation of catalyst that can be corrected for. The sample data was corrected with all quantifiable baseline effects utilizing averages from four baseline runs. The data is reported with and without the particular corrections even though the extent of the corrections, which is about 0.1%, was on the order of the error in the measurement. In addition to measuring the percent total weight loss from all types of carbon, the protocol also calls for measuring the thermal stability of the main constituent, i.e., the sum total of peaks in the derivative curve and the primary peak in the temperature of the derivative weight loss curve.
Results and Discussion
Table 1 depicts the results of the analysis of the four replicate sample runs, which were higher than the pre-determined weight of 3 mg.
Table 1. Results
| Sample Name |
Average |
Ave Dev |
Std Dev |
| % Wt at 900 °C without corrections |
33.38 |
0.21 |
0.27 |
| % Wt at 900 °C with corrections |
33.13 |
0.22 |
0.29 |
| % Wt after cooldown |
33.59 |
0.20 |
0.25 |
| % Wt after cooldown with corrections |
33.34 |
0.20 |
0.26 |
Figure 4 shows the data plots. The test reproducibility is steady with that of other weight loss-on-ignition thermogravimetric analysis tests. The test shows that this sample is approximately 66.7% carbon and 33.3% residue of at least two types. Figure 5 shows four samples of SWCNT.
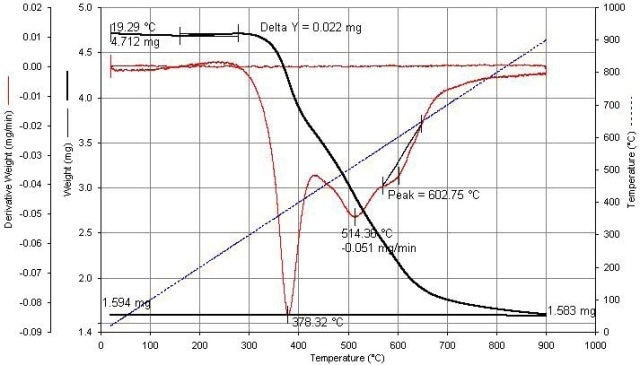
Figure 4. SWCNT calculations are shown above.
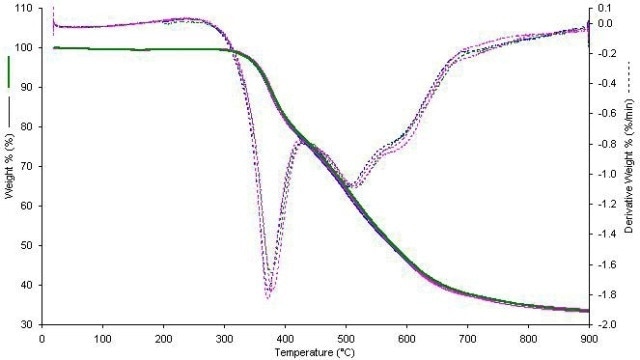
Figure 5. Four samples of SWCNT.
The peaks in the derivative data indicate that there are kinetic variations between the oxidation reactions of another carbon species and SWCNT. A peak resolution algorithm, along with data from oxidation of purified parts may help to approximate the SWCNT yield. The shoulder at approximately 600°C is due to chemical variations in the catalyst residue.

This information has been sourced, reviewed and adapted from materials provided by PerkinElmer Inc.
For more information on this source, please visit PerkinElmer Inc.