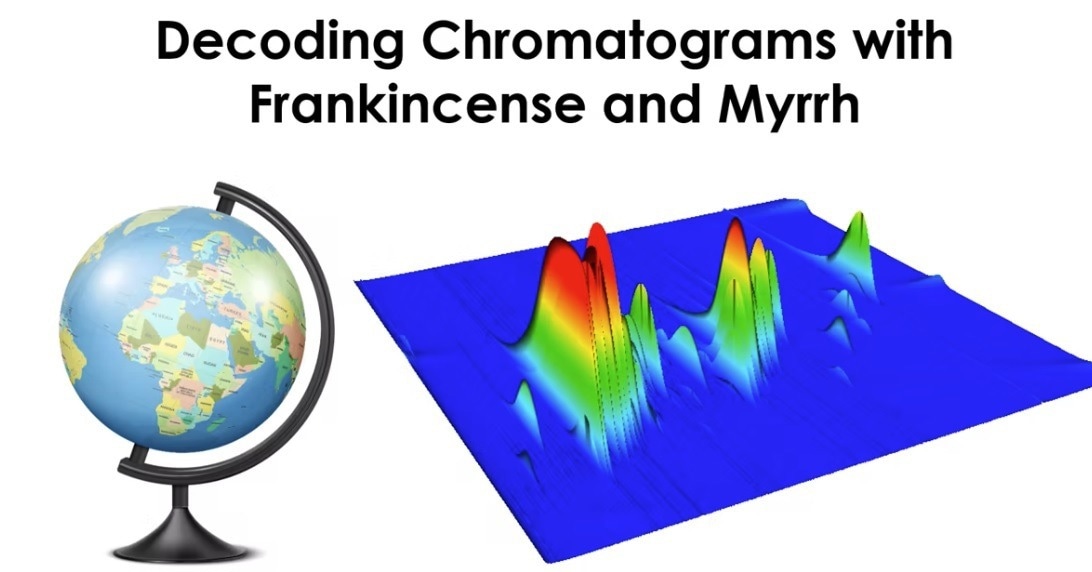
GCxGC chromatograms can be read kind of like a map. Similar to how maps provide relevant information on where to find specific buildings, GCxGC chromatograms can show where specific compound classes can be found. This works as a result of the structured nature of GCxGC data.

Image Credit: LECO Coporation
By using two columns with complimentary stationary phases, compounds can be separated by both phases in a single analysis. This leads to bands of compound classes across the chromatographic space.
When combining a non-polar column with the polar column, the least polar compounds are displayed in the first band, and the most polar compounds appear in the last band. Analytes in these bands have progressively increasing boiling points along the first dimension. The ability to recognize these bands facilitates quick and easy visual comparisons of each sample’s general characteristics.
Using the Contour Plot
Consider frankincense and myrrh, for example. These two aromatic resins may appear to be similar, but their chromatograms display very distinct and different bands of compounds. The terpene band, which runs along the bottom of the chromatogram, can be readily identified using the contour plot. There are three groups in this band; monoterpenes, sesquiterpenes, and lastly, diterpenes.
Enlarging and zooming in on the first band enables a close inspection of the monoterpenes; these are very high in frankincense and very low in myrrh. The spectral data and the first dimension retention index data demonstrate what specific monoterpenes are present.
This led to the discovery of compounds such as alpha pining and limonene, both with aromas very closely related to the general frankincense description, which is musty pine with citrus and spicy notes.
Extra Clarity
The contour plot also shows furanosesquiterpenoids, which make up another band above the sesquiterpenes. It first appears that these are much higher in myrrh compared to frankincense. Using the spectral and retention index information, specific compounds can be identified in this band. This highlights specific qualities that can be described as distinctly myrrh in their aromas.
Therefore, the different properties between frankincense and myrrh become clear to see, and by using contour plots like maps and understanding where these bands fall, the differences are readily traceable. Moreover, the chromatograms and samples become a little more familiar, making mapping GCxGC easier to conduct and providing the user with extra clarity.

This information has been sourced, reviewed, and adapted from materials provided by LECO Corporation.
For more information on this source, please visit LECO Corporation.