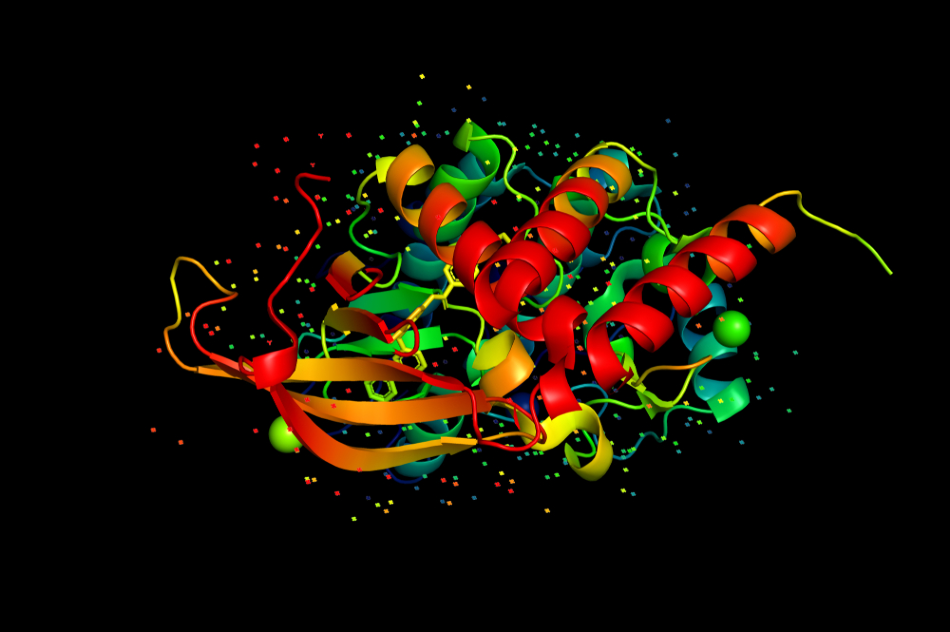
UV microspectroscopy is used in the study of optical properties of individual crystals and also for quality control of growing crystals. UV-visible range microspectroscopy is a key technique for individual protein crystal analysis. Presently, protein crystals are used in controlled drug delivery, structural biology and drug design, and bioseparations.

Image Credit: Shutterstock/Sergei Drozd
For locating, qualifying and analyzing biocrystalline materials in a fast, easy and non-destructive manner, Craic Technologies offers the 20/20 PV microspectrophotometer.
Experiment
In this experiment series, four different samples were studied using absorbance microspectroscopy. Samples 1, 2, 3, and 4 comprised DNA crystals, flavoprotein crystals, Co salt crystals in solution, and DNA-protein crystals, respectively. The 20/20 PV was configured for transmittance and fluorescence for this range of experiments. The objective used was of the 15x Schwarzchild type, as it has a very long working distance and spectral consistency across the entire UV, visible and NIR regions.
From each sample, 200 µl of solution was taken and placed in a Costar 96 well plate, which exhibits good UV transmission characteristics. The location of a crystal was identified and the system was optimized using Kohler illumination. A reference was run off to the side of each crystal before obtaining the spectrum of the crystal. Thus, the spectral characteristics of the well plate, the solution and the instrument are eliminated. The final spectrum will be of the crystal only.
Results
The absorbance spectra of the four samples were measured (see Figure 1). Samples 1, 2, 3, and 4 were labeled as DNA crystal, flavoprotein, salt crystal in solution, and DNA/protein crystal, respectively. All spectra except that of the salt exhibited an absorbance peak at 286 nm. The DNA crystal exhibited a very intense peak, which indicates a high optical density. Also, this was the only peak for the DNA crystal.
.jpg)
Figure 1. Overlay of absorbance spectra of Samples 1–4.
The flavoprotein exhibited peaks at wavelengths of 354, 414, 442 and 446 nm during initial examination. However, during repeated examinations, the flavoprotein spectrum showed some change (see Figure 2). The spectrum of the DNA/protein crystal showed a peak at 352 nm.
.jpg)
Figure 2. Overlay of flavoprotein crystal absorbance spectra at short and longer term exposure to oxygen.
Images of each of the crystals were also obtained (see Figure 3). The black square indicates the entrance aperture of the microspectrophotometer, which was 15x15 µm.
.jpg)
Figure 3. Crystal images. Clockwise from top left: the DNA crystal, the flavoprotein crystal after it had begun to dissolve, the salt crystal in solution, and the DNA/protein crystal.
Conclusions
UV-visible absorbance spectra of a DNA crystal, a flavoprotein crystal, a salt crystal, and a DNA/protein crystal were obtained using the 20/20 PV microspectrophotometer. All the spectra could be easily distinguished and the optical densities were also comparable. Moreover, the change in the flavoprotein spectra was also monitored using the 20/20 PV.
About Craic Technologies
CRAIC Technologies™ is the leading developer of superior instruments for UV-visible-NIR microanalysis. Spectra and images of sample features ranging from sub-micron to hundreds of microns can be analyzed. CRAIC Technologies products include UV and NIR microscopes, UV-visible-NIR microspectrophotometers, instruments to measure thin film thickness and colorimetry on the microscopic scale, Raman microspectrometers, automation solutions, traceable standards and more. Specialized systems have been developed for a number of fields including vitrinite coal analysis, protein crystals, forensic and semiconductor metrology.

This information has been sourced, reviewed and adapted from materials provided by CRAIC Technologies.
For more information on this source, please visit CRAIC Technologies.