Introduction
Magnesium (Mg) is strong, stiff, and lightweight, making it the most widely used element in engineered structures after iron and aluminum. Its strength and stiffness can be further improved when alloyed with aluminum.
Nevertheless, bulk mechanical properties rely greatly on chemical composition and thermomechanical history, as these factors influence microstructure. This article discusses the application of nanoindentation to measure the properties of individual phases within a commercially available alloy, AZ 61.
AZ 61 Magnesium Alloy
AZ 61 contains aluminum (nominally 6%), zinc (nominally 1%), and other trace elements. Table 1 summarizes the chemical composition for AZ 61. The presence of zinc and other trace elements has little impact on the microstructure, and the phase diagram is used to deduce the composition of slowly cooled AZ 61.
At 6% aluminum, the Mg-Al phase diagram deduces the interaction of two phases: an α phase that is Mg-rich and a β phase comprising the intermetallic compound Al12Mg17.
Table 1. Chemical composition of magnesium AZ 61 alloy [2].
| Element |
% by mass |
| Aluminum |
5-7 |
| Zinc |
0.8-1 |
| Copper |
<0.03 |
| Silicon |
<0.01 |
| Iron |
<0.01 |
| Nickel |
<0.005 |
| Magnesium |
Balance |
When the alloy cools from the liquid state, the α phase starts solidifying at about 620°C and the solidification process completes at 540°C, at which point the material exists completely in the α phase. The precipitation of the β phase begins at around 300°C and the mass fraction of this secondary phase keeps on increasing as the temperature continues to decrease. At temperatures less than 100°C, the β phase represents about 7.5% of the alloy.
Instrumentation
The KLA Express Test option is used in this analysis due to its ability to achieve unprecedented testing speeds by implementing conventional indentation testing in an innovative way. Express Test carries out one complete indentation cycle per second, which includes approach, contact detection, load, unload, and movement to the next indentation site.
Express Test can quantitatively ‘map’ the elastic modulus and the hardness of a surface in a reasonable time. This quality is especially advantageous for analyzing multiphase metals like AZ 61.
Sample Preparation and Experimental Procedure
The AZ 61 sample analyzed was prepared by scientists at the Materials Science and Engineering Department at Drexel University. AZ 61 chunks were procured from Thixomat (Livonia, MI). The chunks were put in alumina crucibles that were enclosed with alumina disks. The crucibles were then put into a vacuum furnace, heated at a rate of 10°C/min up to 750°C, and then kept at this temperature for one hour. Then the furnace was switched off and the samples were allowed to furnace cooling.
A part of the sample was cut, mounted, and rough ground with water using silicon carbide, starting with 400-grit and concluding with 1200-grit (US). The resulting samples were then polished utilizing 6µm and 1µm diamond on a medium nap cloth with an alcohol-based extender.
A KLA Nano Indenter G200 equipped with the Express Test option, KLA NanoVision software, and a KLA DCM II head fitted with a Berkovich indenter was used to perform all indentation testing.
The test method ‘Express Test to a Force’ was applied to carry out an array of 20x20 indents within a 50µm x 50µm area, meaning that the distance between successive indents was roughly 2.5µm. The peak force of 4mN for every indent produced a peak displacement of about 380nm and about 240nm in the α phase and the β phase, respectively.
Experimental Results
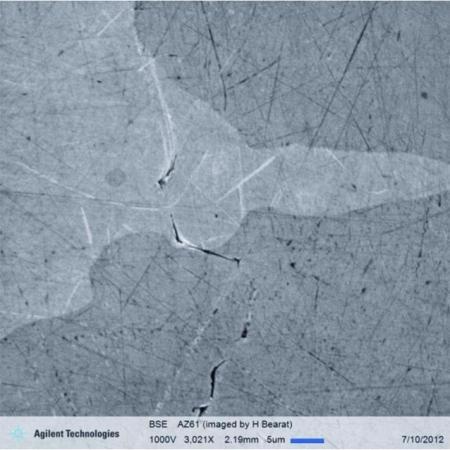
Figure 1 is an SEM image showing the microstructure of the AZ 61 surface as prepared for indentation. The α phase is darker and the precipitated β phase is lighter. As can be seen in the image, the scratches that extent both phases are smaller in the β phase, revealing that the β phase has higher hardness.

Figure 1. Low-voltage, field-emission, scanning-electron-microscopy (LV FE-SEM) image of Mg AZ 61 as prepared for nanoindentation. Acquired in back-scattered electron (BSE) mode. Image resolution is 1024x1024 pixels. Smaller scratches in the β phase evidence higher hardness.
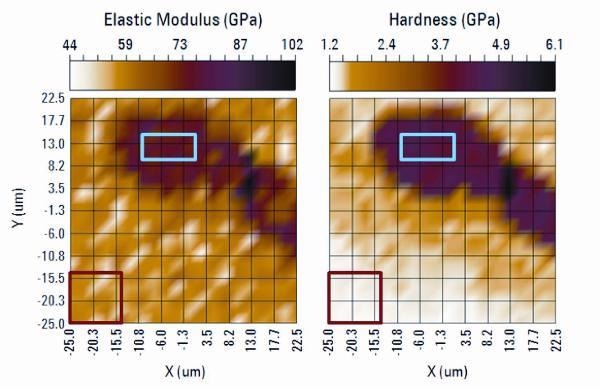
The maps of elastic modulus and hardness created by a 20x20 array of indentations are depicted in Figure 2. It takes 15min to perform the entire test. Each indentation produces the information content for one pixel. Hence, the images in Figure 2 are 400-pixel (20x20) images, which clearly differentiate the two phases. To measure the properties of each phase independently, two rectangular domains are chosen that were obviously in either one phase or the other (red and blue rectangles in Figure 2).

Figure 2. Modulus and hardness of two-phase Mg AZ 61. Red rectangles are in the primary β phase (Mg-rich). Blue rectangles are in the ? phase (Al12Mg17). Information for both images was acquired in 15 minutes by means of Express Test. Image resolution is 20x20 pixels.
The red rectangle is in the α phase, which is the Mg with interstitial Al that makes up roughly 92% of the material. There are 25 indentations within the area of the red rectangle, with an average hardness of 1.35±0.05GPa and an average elastic modulus of 54.9±3.3GPa, a value slightly greater than the modulus of pure Mg (45GPa).
The blue rectangle is in the β phase, which is predominantly Al12Mg17. There are 15 indentations within the area of the blue rectangle, with an average elastic modulus of 75.8±3.3GPa and an average hardness of 4.3±0.19, a value three times higher than the hardness of the α phase. Table 2 provides the properties of each phase.
Table 2. Properties of magnesium AZ 61.
| |
Present work 4mN applied force |
Relevant Comparisons |
| Materials |
N |
E (std.dev.) GPa |
HE (std.dev.) GPa |
Material |
E GPa |
Ref |
| α-phase (Mg-rich) |
25 |
54.9 (3.3) |
1.35 (0.05) |
Mg |
45 |
[1] |
| β-phase (Al12Mg17-rich) |
15 |
75.8 (3.3) |
4.30 (0.19) |
Al12Mg17 |
78 |
[4] |
However, the hardness image shows a region around the β phase wherein the hardness is greater than that of the α phase, but lower than that of the β phase. There are two reasonable clarifications for this observation. The elevated hardness of the material around the β phase may be due to the β material immediately below the exposed surface.
Nevertheless, modulus is typically more susceptible to the influence of constraining material and is homogenous outside the β phase. Since the variation in hardness between the two phases is much higher than their difference in modulus, the hardness may manifest more constraint effect compared to modulus.
The second clarification is that the material surrounding the β phase may be a true ‘mesophase’ if its chemical composition is different from that of either α phase or the β phase. In-depth analysis is required to fully understand this phenomenon.
Conclusions
The results clearly demonstrate the ability of the Express Test option for the KLA Nano Indenter G200 to map the properties of individual phases within a magnesium alloy.

This information has been sourced, reviewed and adapted from materials provided by KLA Corporation.
For more information on this source, please visit KLA Corporation.