Introduction
The primary purpose of the work presented herein is to investigate the mechanical properties of a lithium rechargeable battery cathode1-3 by utilizing both the classic XP CSM and newer, ultrafast DCM Express Test methods with a Nano Indenter G200 (KLA). Scanning electron microscopy analysis is used as a support to understand the obtained results and gain information about the differences between the two adopted nanoindentation methods.
Particular attention is focused on the analysis of the mechanical and elastic properties of new-generation lithium/polymer electrodes, with the final aim of correlating the life cycle and the number of charge and discharge cycles with the mechanical properties of the electrodes.
By employing an improved grid nanoindentation method4-6, it is possible to perform a statistical deconvolution of the mechanical properties and to understand how many (and which) heterogeneous material phases there are as well as how they interact among themselves.
A final aspect of interestrelated to the lithium/polymer batteries is to investigate the mutual mechanical interactions among the different components in order to gain information on the correlation between chemical and mechanical properties.
A lithium/polymer battery1-3 is made of lithium-polymer conductive composite materials, obtained by embedding lithium salt solutions in opportune polymeric matrix. The polymeric cells have a flexible sheet structure, so external pressure is not needed since the electrode sheets and the separator (dielectric) are laminated one on top of the other.
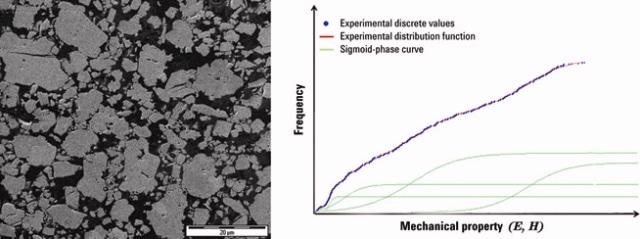
This kind of battery has the significant advantage of being realized in any form or dimension and, owing to the lack of usefulness of any metal container, the battery could be lighter and shaped to fill the space reserved for it. An example of a cathode’s microstructure is shown in Figure 1a.

Figure 1. (a) Example of a microstructure of a lithium/polymer battery cathode. (b) Principle of property deconvolution using the cumulative distribution function (CDF).
The principal critical issue associated with the functional behavior of such devices, however, is intrinsically related to the strong difference, in terms of mechanical properties, between the two main components of the composite material. In light of this, evaluating the mechanical properties of such materials by using proper nanomechanical testing is extremely important.
Here, we report on an investigation of mechanical properties using an improved statistical nanoindentation method, described in the next section. The developed procedures allow the accurate determination of the elastic and plastic properties of each single phase, together with a careful analysis of the gradients of the same properties within single particles, an aspect that becomes more important when analyzing the mechanical property loss after several charge/discharge cycles.
Statistical Nanoindentation Method
The statistical (or grid) nanoindentation method was originally proposed for cement-based materials4. The method consists of the realization of grids of hundreds of indentation tests, coupled with a statistical analysis (deconvolution) of either the elastic modulus or hardness data for the identification of the different mechanical phases and their distribution over the sampled area.
The deconvolution process is applied to the cumulative distribution function (CDF) of obtained data and utilized to get the weighted sum of hoarded curves that best fit the empirical cumulative probability distribution.
A generic cumulative distribution function (CDF) is given by:

Where Dj(x) is the hoarded probability distribution of the j phase:
 with i E [1,N] being
 .jpg)
There are 3n-1 unknowns, which are calculated imposing that the theoretical function has a minimal square deviation compared with the empirical cumulative probability curve shown from the indentation tests:
(μj, sj, fj) from min 
Where Fi are the empirical values of the cumulative probability corresponding to the i-class.
The principle of the method is reported in Figure 1b.
Employing the cumulative function is extremely useful when the number of phases in the material under investigation is mostly unknown; in fact, when the cumulative experimental function is built, it is possible to find the polynomial that best fits the cumulative curve (see Figure 1).
The number of phases can be correlated to the polynomial order of the CDF that best fits the experimental cumulative curve. If n is the polynomial order of the CDF, the number of real phases will be equal to n-2 (i.e., the number of flexes).
Experimental Details
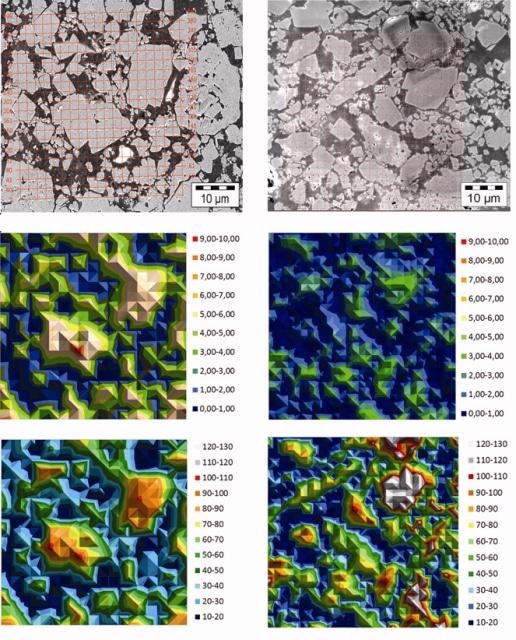
A lithium-ion battery cathode, composed of a mixture of active particles (LiMn2O4) and carbon black in a polymeric matrix of polyvinylidene fluoride (PVDF), was embedded in epoxy and mirror- polished before mechanical testing. The cathode thickness is about 150µm. Lithium particles exhibit significant variance in their size and internal porosity, as shown in Figure 2, leading to a different response in terms of mechanical properties.

Figure 2. (a) XP CSM nanoindentation grid. (b) DCM Express nanoindentation grid. (c) XP CSM standard – hardness [GPa], calculated at depth 100 nm. (d) DCM Express – hardness [GPa]. (e) XP CSM standard – modulus [GPa], calculated at depth 100 nm. (f) DCM Express – modulus [GPa].
The methodology developed in this work is mostly based on the combined and synergic application of several experimental techniques:
- Scanning electron microscopy morphological analysis before and after nanoindentation testing
- Nanoindentation tests with standard XP CSM mode and DCM Express Test mode
- Improved statistical analysis, consisting of 2D mapping of mechanical properties (elastic modulus E, hardness H) as well as deconvolution of the cumulative distribution functions for the analysis of single-phase mechanical properties
The deconvolution process is performed using a MATLAB-based routine.
XP CSM tests were performed using a Berkovich tip, with a frequency of 45Hz, amplitude of oscillation 2 nm, constant strain rate 0.05s-1, and maximum penetration depth 150nm (which roughly corresponds to 1.0µm of lateral dimension of indents). The results allow the statistical analysis of obtained data at different penetration depths.
A grid of 20x20 indents was realized; spacing between indents was fixed at 10µm. Thus, any mutual interactions between contiguous indentation marks can be assumed to be negligible. Shallower indents would be required for a finer mesh. A full weekend session was needed to complete 1 matrix (400 indents).
DCM ultrafast tests were performed using the KLA Express Test method and a Berkovich tip, fixing a maximum depth of 80 nm, a spacing of 1.5µm, and an area of analysis of 50x50 µm2. Six different matrices were performed in a single session (roughly 2 hours to realize more than 5000 indents).
The Nano Indenter G200 was completely re-calibrated (area function and frame stiffness), both before and after testing, by performing a series of indentations on a certified amorphous fused-silica reference sample. Detailed microstructural and compositional observation of the same areas of the tests were finally performed by scanning electron microscopy analysis.
Results and Discussion
The obtained mechanical maps (Figures 2c–f) show a good representation of the actual microstructure and phase distribution, in comparison with the scanning electron microscopy images (Figures 2a–b). After a careful analysis of both the load-displacement curves and the scanning electron microscopy images, all the out-of-range tests were clearly correlated to the presence of micro-cracks or porosity in correspondence with the indentations.
The CSM approach mode used in the tests with the XP indenter head is useful to highlight that the mechanical maps at the three different depths (i.e., 50, 100, 150nm) show, with qualitative agreement, different values of hardness and elastic modulus. This is due to the effects of the surrounding compliant matrix on the stiffer particles.
Modulus and hardness values increase (on average) with decreasing indentation depth when looking at the CSM data. The gradients of hardness and modulus over a single particle are reduced with decreasing penetration depth. This is a direct consequence of the relevance of the edge effects, which obviously are reduced as the penetration depth is reduced.
The XP CSM method makes it possible to choose, for the calculation of the average value of hardness and elastic modulus, the range of displacement into the surface. In this work, the ranges selected are 45–55, 95–105, and 145–155.
The XP CSM method permits discrimination between the artifacts of roughness effects, which affect the lower displacement, and of substrate influence, which affect the higher displacement. This second effect is particularly significant in the evaluation of elastic modulus, which is a massive property.
The XP CSM data, however, proved insufficient to achieve reliable deconvolution of the actual mechanical properties, due to the limited number of valid tests that can be obtained in a reasonable amount of time. Use of the Express Test method was then required in order to gain more reliable information on the single-phase hardness and modulus (see Figure 3).

Figure 3. (a) CDF analysis (for the hardness) on 400 indents obtained by the conventional XP CSM method at 100nm depth. (b) CDF analysis (for the elastic modulus) on 400 indents obtained by the conventional XP CSM method at 100nm depth. (c) CDF analysis (for the hardness) on 900 indents obtained by the DCM Express method at 80nm depth. (d) CDF analysis (for the elastic modulus) on 900 indents obtained by the DCM Express method at 80nm depth.
The optimization of the CDF enables the identification of the four most representative phases, described below:
- A phase representing the lithium particles (the higher values of hardness and the lower values of elastic modulus)
- A phase representing the matrix (the lower values of hardness and the higher values of elastic modulus)
These first two peaks are characterized by a relatively small standard deviation, a direct suggestion that they really represent the properties of the two main constituents.
- Two phases representing the matrix influence for the smaller particles, the edge effect, the defects in the particles (the intermediate values), and roughness effects
These last two peaks are characterized by a relatively higher standard deviation, a direct suggestion that they represent the properties of various artifacts.
It is interesting to note how the elastic modulus value achieved with DCM Express Test is higher than the values obtained with XP CSM, due to the higher strain rate applied during indentation and the viscoelastic properties of the polymer matrix.
Summary
Ultrafast DCM Express Test nanoindentation testing performed with a KLA Nano Indenter G200 is extremely useful for the identification of single-phase mechanical properties and their spatial distribution in lithium/polymer battery composites. Careful mapping of elastic modulus and hardness, together with robust statistical analysis, allows a reliable analysis of the micro structural/mechanical features of such materials.
The effects of applied strain rate and the selection of the optimal penetration depth for lithium/polymer heterogeneous materials is possible by the comparison between XP CSM and DCM Express nanoindentation mapping results.
References
[1] P. Kurzwell, K. Brandt, Secondary batteries – Lithium rechargeable systems (2007).
[2] J. Zhu and K. Zeng, Electrochimica Acta, 15:52–59, 2012.
[3] J. Vetter, P. Novak, M.R Wagner, C. Veit, K.-C. Muller, J.O. Besenhard, M. Winter, M. Wohlfahrt-Mehrens, C. Vogler, and A. Hammouche – Ageing mechanisms in lithium-ion batteries. J Power Sources, 147:269–281, 2005.
[4] G. Constantinides, F.J. Ulm, J. Mech. Phys. Solids 55 (2007) 64–90.
[5] M. Vandamme, F.J. Ulm, P. Fonollosa, Cement Concr. Res. 40 (2010) 14–26.
[6] M. Vandamme, F.J. Ulm, Cement Concr. Res. 52 (2013) 38–52.
Authors
M. Sebastiani, F. Massimi, R. Moscatelli, Edoardo Bemporad (University of Rome “Roma TRE”, Engineering Department, Italy)
D. Rosato (Robert Bosch GmbH)
H.-Y. Amanieu (Robert Bosch GmbH, Duisburg Essen University)

This information has been sourced, reviewed and adapted from materials provided by KLA Corporation.
For more information on this source, please visit KLA Corporation.