When additives are mixed with base oils for use as lubricants, the concentrations of certain elements need to be known and controlled for longer engine life and optimal performance. A method has was developed by ASTM to monitor this crucial procedure: ASTM method D4951, which covers barium (Ba), boron (B), calcium (Ca), copper (Cu), magnesium (Mg), molybdenum (Mo), phosphorus (P), sulfur (S), and zinc (Zn). However, not every element needs to be measured every time. The additives and blends are specified to satisfy certain performance specifications which can vary among oil types in relation to their final use.

Around 10-40 samples per day are typically analyzed by oil blending facilities to support manufacturing processes. Due to the low sample load, relatively high concentrations, and small number of elements, the most common mode of analysis is by ICP-OES, or X-ray, with each technique having its advantages and disadvantages.
This article focuses on the analysis of additives in new oils by employing PerkinElmer’s Avio™ 200 ICP Optical Emission Spectrometer1 (ICP-OES), which overcomes the disadvantages of X-ray analyses and other ICP-OES systems.
Experimental
Samples and Standards Preparation
New oil samples were obtained and diluted 10x by weight using V-Solv™ 40 ppm which contains cobalt (Co) as an internal standard. Calibration curves were made from a 75 cSt base oil as a blank, two V-23 stock solutions at 100 and 500 ppm (PerkinElmer), and a Metals Additives Standard (MA4) (PerkinElmer) containing Mg, P, and Zn at 1600 ppm as well as Ca at 5000 ppm. All standards and the blank were prepared in the same way as the samples. During the sample analysis, the MA4 standard was used as the QC sample.
Instrument Conditions
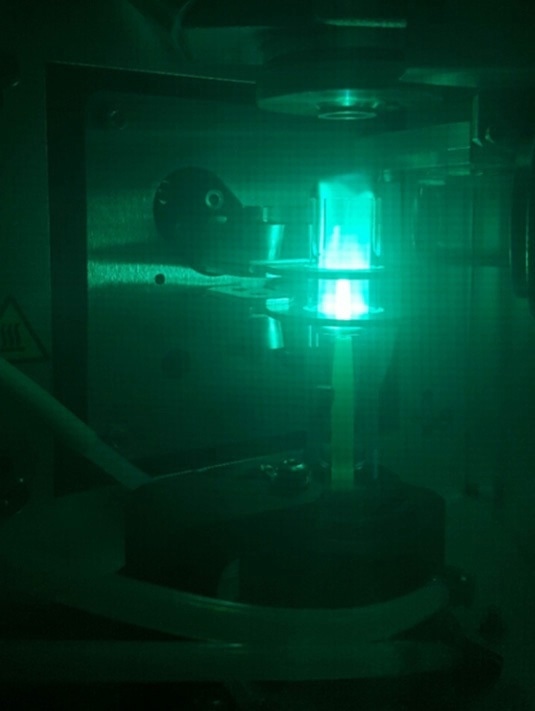
The Avio™ 200 ICP-OES was operated in radial mode in order to perform the analyses, using the conditions shown in Table 1, together with the wavelengths and analytes listed in Table 2. The gas flow of the nebulizer was adjusted so that the tip of the “green bullet” in the central channel was just below the top flat plate (Figure 1).
Table 1. Avio™ 200 ICP-OES instrumental parameters and conditions.
| Parameter |
Value |
| Nebulizer |
MEINHARD® K-1 |
| Spray Chamber |
Baffled glass cyclonic |
| RF Power |
1500 W |
| Torch |
3-Slot Avio torch for organics |
| Injector |
1.2 mm |
| Plasma Gas Flow |
10 L/min |
| Aux Gas Flow |
0.8 L/min |
| Nebulizer Gas Flow |
0.40 L/min |
| Torch Position |
-4 |
| Sample Uptake Rate |
1.3 mL/min |
| Sample Uptake Tubing |
Black/Black (0.76 mm id), Viton |
| Drain Tubing |
Red/Red (1.14 mm id), SolvaFlex |
| Replicates |
3 |
| Rinse Between Samples |
40 sec (flush, read delay, AS rinse) |
| Auto Integration Time |
Min 0.5 secs, Max 2.0 secs |
Table 2. Analytes and wavelengths.
| Element |
Wavelength (nm) |
| Ca |
315.887 |
| Mg |
279.077 |
| P |
214.914 |
| Zn |
213.857 |
| Co (internal standard) |
228.616 |

Figure 1. Correct position of green carbon "bullet" just below the second plate of Avio’s unique Flat Plate™ plasma technology, when aspirating V-Solv™.
Results and Discussion
The analysis was performed on five new oil samples with different formulations, and a comparison was made of their concentrations, with those obtained from X-ray analysis using ASTM D6443. Table 3 illustrates the results indicating that both analyses provide similar results, thus showing a match with the X-ray results. Moreover, the relative standard deviations (RSDs) for each measurement were generally less than or equal to 1%. The exceptions were the low-level analytes (Mg in Oil 3 and 5) in which the low intensities yielded statistically slightly higher RSDs.
Table 3. Results from five new oil samples with different formulations.
| Oil Sample |
Element |
Concentration (ppm) |
X-Ray Results (ppm) |
| 1 |
Ca
Mg
P
Zn |
1136
1017
1114
1284 |
1131
1045
1131
1291 |
| 2 |
Ca
Mg
P
Zn |
1372
842
1141
1321 |
1404
863
1170
1353 |
| 3 |
Ca
Mg
P
Zn |
2457
19
710
875 |
2494
11
756
843 |
| 4 |
Ca
Mg
P
Zn |
1338
827
994
1142 |
1342
838
991
1139 |
When compared with X-ray analysis, the Avio™ 200 ICP-OES offers several benefits, including sample throughput, ease of use, price, and the ability to measure different oil formulations with calibration standards that do not have to be matched to the composition of each oil sample. Moreover, X-ray analysis of additives in oils suffers from interferences, which necessitate either physical or mathematical corrections, both of which require running additional standards. However, there are no interferences in ICP-OES, thus offering faster, simpler, and more accurate measurements. One more difference between ICP-OES and X-ray includes its capacity for measuring high-level samples. X-ray methods require additional dilutions of the sample, while the same sample can be run in attenuation mode on the Avio™ 200, thus selectively suppressing the signal of only the analyte of interest and without influencing other analytes.
A common blending plant may run about 20 samples per day. Hence, a 20-sample stability run was carried out in which each oil sample was run. This was followed by the QC sample (MA4) after every five samples. This procedural sequence was repeatedly carried out so that each oil sample was analyzed four times. All QC values were within ± 2%; Table 4 shows the first and last QC samples. These results show the stability of the technique, so that a typical oil blending plant can easily perform their daily analyses with the Avio™ 200 ICP-OES.
Table 4. First and last QC check samples of a 20-sample analytical run.
| Sample |
Element |
Experimental (ppm) |
% Recovery |
| First QC |
Ca
Mg
P
Zn |
4994
1614
1602
1587 |
100
101
100
99 |
| Last QC |
Ca
Mg
P
Zn |
5093
1631
1630
1625 |
102
102
102
102 |
Several instrumental considerations of the Avio™ 200 ICP-OES provide its stability. First, the vertical torch is used in such a manner that any non-ionized sample will drain back down the torch instead of pooling in the injector and causing a more rapid buildup of carbon on the torch and injector. The end of the plasma is cut off by the shear gas, so that deposition on the axial window is prevented. Although this analysis does not employ axial mode, the feature enables the use of Avio™ for other analyses with no worries about deposition or cone maintenance. Finally, Avio’s unique Flat Plate™ plasma technology, forming the plasma (Figure 1), is strong, and does not require cooling; leading to increased stability. The flat plates also help in reducing the consumption of argon; just 11.2 L/min of total argon was utilized in these analyses.
One additional use of the ICP for an oil blending plant relates to the checking of other additives that are used in the oil formulation (such as dispersants, detergents, and viscosity improvers). This is important since elemental contamination could change the additive levels in the final product.
Conclusion
This article has shown that the Avio™ 200 ICP-OES can analyze various lubricating oil samples for oil additives to conform to ASTM method D4951. Instrumental design considerations enable stable and accurate analysis of different oil formulations against an external calibration curve, which need not be matched to the specific oil compositions.
Consumables Used
| Component |
Part Number |
| Sample Uptake Tubing, Black/Black (0.76 mm id), Viton |
N0773118 |
| Drain Tubing, Red/Red (1.14 mm id), SolvaFlex |
09923037 |
| Metal Additives Standard, MA4 |
N9308259 (100 g)
N0776108 (200 g)
N9308333 (400 g) |
| V-23 Wear Metals Standard, 100 µg/g |
N9308245 (100 g)
N0776105 (200 g)
N9308318 (400 g) |
| V-23 Wear Metals Standard, 500 µg/g |
N9308249 (100 g)
N0776106 (200 g)
N9308320 (400 g) |
| Cobalt Internal Standard, 6% in hydrocarbon oil |
N0776107 (200 g)
N9304168 (400 g) |
| V-Solv Solvent |
N9308265 (1 gallon)
N9308378 (5 gallons) |
| Sample Tubes, 17x100 mm, 1200 |
N0777167 |
References
1. http://www.perkinelmer.com/product/avio-200-icp-optical-emission-spectrometer-avio200

This information has been sourced, reviewed and adapted from materials provided by PerkinElmer Inc.
For more information on this source, please visit PerkinElmer Inc.