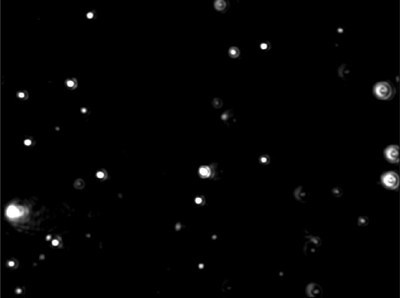
Both techniques measure Brownian motion and relate this movement to an equivalent hydrodynamic diameter, with the motion of smaller particles becoming more exaggerated. NTA measures this movement through image analysis (fig.1) tracking the movement of the particles on a particle-by-particle basis, this movement can be related to particle size. DLS does not visualize the particles. DLS observes the time dependent fluctuations in scattering intensity caused by constructive and destructive interference resulting from the relative Brownian movements of the particles within a sample. Through application of the auto-correlation function and subsequent calculation of the exponential decay, average particle size can be calculated from time-dependent fluctuations in light intensity (refer to ISO 13321 for further details).

Figure 1. Typical image produced by NTA Technique.
What Does This Mean in Practise?
Polydisperse Sample
For polydisperse samples (samples containing a range of particle sizes) in general the NTA approach is better suited due to the particle-by-particle measurement. DLS produces an average particle size due to the ensemble measurement (all particles measured at the same time) and is biased towards larger particles within the sample (by virtue of the fact they scatter light more intensely than the smaller particles). The NTA approach does not give an average particle size and hence is not biased towards the larger particles. For bimodal samples the particle-by-particle approach allows resolution of discrete populations with a size ratio of 1:1.33 (for example 300 nm particles could be discriminated from 400 nm particles). In DLS because of this intensity bias it is difficult to exceed a practical resolving power of 1:4 i.e 100 nm particles can be resolved from 400 nm particles.
Monodisperse Sample
For samples in which particles are all the same size (monodisperse) DLS produces an accurate average particle size as there is no intensity bias. The average is produced from a large number of identical particles and hence the measurement is accurate and repeatable.
For NTA the distribution is formed from a smaller population of particles (thousands rather than hundreds of thousands with DLS) and hence the results are potentially less statistically robust than with DLS. Repeatability is 1% with NTA compared to better than 1% with DLS.
Number Distribution
As NTA tracks particles within a known volume, the size distribution which is produced is a Number Distribution and relative particle concentrations can be determined.
DLS produces an intensity distribution which can then be converted to a volume distribution. This conversion relies on a number of assumptions, when this data is then further converted to a number distribution, errors in the original conversion are compounded and hence number distributions as calculated through DLS are generally considered to be inaccurate.
Refractive Index
NTA does not use the intensity of light scattered as a measured and hence there is no requirement for knowledge of the solvent refractive index of the solvent in the calculation. Particle refractive index also has implications when considering samples with mixtures of refractive indices.
As more refractile particles scatter more light, the particle size distribution is weighted towards the more brightly scattering particles in DLS. This causes errors in samples with mixtures of materials e.g. coated/uncoated particles, loaded/unloaded liposomes, porous/nonporous particles. In all cases the size distribution will be weighted towards the larger/more refractile particles.
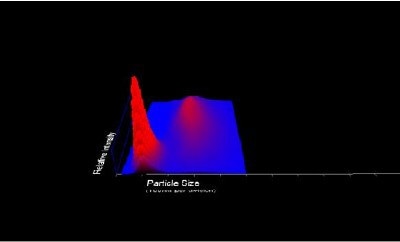
NTA records the particle intensity even though it is not used in the size calculation. This opens the possibility to discriminate between particles of a similar size but different refractive index, meaning the NTA technique lends itself to analysis of more complex mixtures both in terms of refractive index and polydispersity (fig.2).

Figure 2. Image showing 3D graph of particle size vs relative intensity vs concentration using the NTA technique.
Concentration
In general the concentrations required in the NTA technique are lower than those required for DLS. The maximum concentration measurable by the NTA technique is 109 particles per ml. The concentration requirements for DLS depend on the size of the particles analyzed. This is due to the fact that larger particles scatter more light and hence their signal is easier to detect. As particles get smaller the concentration of particles required for DLS increases.
Depending upon application, the concentration requirements for both techniques can be problematic. Dilution can cause problems with particle aggregation and therefore for high wt% samples dilution is required in both DLS and NTA (although less dilution is required in general for DLS).
For applications in which there are low numbers of particles present NTA can analyse concentrations as low as 109 particle per ml, which is not possible with DLS for smaller particle sizes.
Summary
|
Characterization
|
Nanoparticle Tracking Analysis (NTA)
|
Dynamic Light Scattering (DLS)
|
|
Size Range (nm)
|
10 - 1000
|
2 - 3000
|
|
Size Resolution
|
1:1.33
|
1:3 in theory, 1:4 in Practice
|
|
Measurement of Polydisperse Sample
|
Particle-by-particle approach allows better resolution of particle sizes. No intensity bias towards larger particles
|
Average particle size which is intensity biased towards the larger/contaminant particles within a sample
|
|
Measurement of Monodisperse Sample
|
Looks at less particles than DLS therefore repeatability is slightly worse than DLS. Equivalent size distribution to DLS
|
Slightly more reproducible than NTA due to average particle size from many more particles
|
|
Refractive Index
|
Requires no information about solvent refractive index. Relative particle intensity can be calculated for samples with a mixture of particle refractive indices
|
Requires solvent refractive index. In samples with a mixture of particle refractive indices, analysis is weighted towards the more refractile particles
|
|
Size Distribution
|
Number distribution
|
Intensity distribution which can be converted into a volume distribution. No accurate information about particle concentration can be calculated.
|

This information has been sourced, reviewed and adapted from materials provided by Malvern Panalytical.
For more information please visit Malvern Panalytical.