From materials science to biological research, scientists have embraced Kelvin Probe Force Microscopy (KPFM) for measuring the likes of surface potential and work functions. KPFM reproduces the principles of Electrostatic Force Microscopy (EFM) operation.
It measures a contact potential difference (CPD), thereby establishing the sample's work function utilizing DC bias feedback. Yet, due to long-range crosstalk as a result of the interaction between the sample and the total body of the cantilever, traditional off-resonance KPFM yields low spatial resolution and low signal-noise ratios.
Sideband KPFM has a peerless spatial resolution and focuses on the local interaction between the tip apex and sample, making it suitable for the analysis of grain boundaries, photovoltaics materials, semiconductor junctions and even molecular structures [1-3].
KPFM works by measuring the CPD: an electrostatic potential that lies between samples of two varying, electrically connected materials. In view of atomic force microscopy (AFM), the two different materials are the sample and the AFM tip.
Each of the materials has a distinct conduction band and an individual work function. The material’s work function is relative to the amount of energy needed to detach an electron to infinity from the surface of a given solid [2].
 |
(1) |
If the sample and tip are connected electrically, the connection will provoke a natural flow of electrons and will generate a potential difference between the two materials (Figure 1). This potential difference can be measured using the theoretical formula of contact potential difference:
 |
(2) |
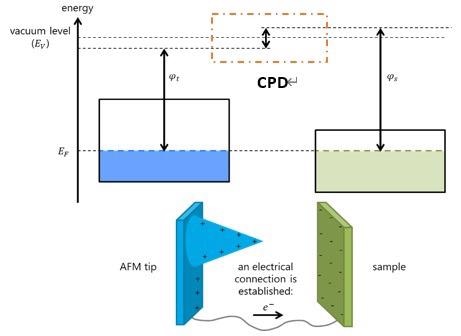
Figure 1. Contact Potential Difference between an AFM tip and sample. Image Credit: Park Systems
Where ϕtip & ϕsample are the work function of the tip and sample, respectively, and ‘e’ is relative to the electronic charge. Acquisition of the work function of the material is feasible by multiplying the material’s surface potential by a single electron charge.
Equation (1) can be described using the Kelvin Probe method, which is dependent on detecting the electric field of the materials formed by the AFM tip and sample. By adjusting the voltage CPD, there are variances in the electric field.
So, when there is an application of an external bias (VDC) of the same magnitude in the reverse direction of the AFM tip, the surface charge of the contact area is canceled out.
Once the electrostatic forces are depleted, the work function difference has an equal value to the applied voltage CPD; as a consequence, the work function of the sample can be determined if the work function of the tip is known (Equation (2) [3].
Off-Resonance KPFM
Analyzing the AFM tip and the sample is made simple when regarding them both as capacitors as calculating the amount of energy can be measured against the difference in voltage and the capacitance.
KPFM utilizes two frequencies to simultaneously receive topography and surface potential. The basic procedure for KPFM is performed by using two lock-in amplifiers (Figure 2A).

Figure 2. Sideband KPFM feedback loop. a) Off-resonance KPFM Loop. b) Sideband KPFM Loop. Image Credit: Park Systems
Modulation of the frequency used to oscillate the cantilever at its mechanical resonant frequency is executed by the first lock-in amplifier using a piezoelectric material to generate a topography image.
The second lock-in amplifier balances the frequency, typically around 17 kHz, to measure the surface potential. This method is known as off-resonance KPFM, as any resonance frequency can be theoretically selected as long as it is not equal to the cantilever's mechanical resonance [2].
Off-resonance KPFM obtains the information relative to surface by measuring the entire interaction of the whole cantilever with the sample, restricting its spatial resolution.
Sideband KPFM
Using the intermodulation of an electrostatic drive force and a mechanical drive force to upconvert the electrostatic frequency to the first flexural resonance, Sideband KPFM is a technique where the high Q ‘quality factor’ generates a finely tuned measurement [3].
In addition, Sideband KPFM signal is determined by utilizing a local interaction between the tip apex and the sample as opposed to the total interaction between the cantilever and the sample: enhancing the spatial resolution when compared to off-resonance KPFM.
Local interaction in the system facilitates the measuring of the surface potential of localized features with high resolution due to the limited interaction with other parts of the cantilever.
The reason for the significant reduction of the interaction, prompted by the cantilever and the tip, is the downward distance dependence on the experimentally important range of the lever and cone forces [1].
The electrical driving frequencies of Sideband KPFM materialize at the sidebands of the mechanical oscillation of the cantilever (Figure 3), moderating the long-range crosstalk [3].
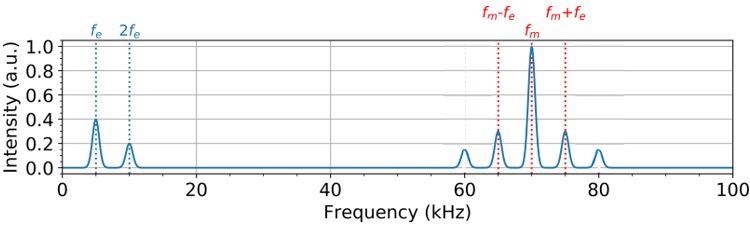
Figure 3. Fourier Transform of the vertical deflection comparing Off-resonance KFPFM vs Sideband KPFM. Image Credit: Park Systems
Sideband KPFM can precisely measure the surface potential with an enhanced resolution (in contrast to off-resonance KPFM) because of the sideband frequencies of the mechanical oscillation and the local interaction of the tip apex.
When conducting Sideband KPFM, rather than using a frequency of 17 kHz, the KPFM mode functions with the Sideband’s frequencies, typically 1-5 kHz off from the cantilever’s mechanical resonance.
This technique utilizes three lock-in amplifiers (Figure 2B) to lock-on to the frequencies of the Sideband. Figure 2B displays the second lock-in amplifier modulating the left Sideband, while the third modulates the right Sideband. The surface potential is obtained by averaging the DC voltage feedback from both sideband frequencies [1].
EFM Amplitude Sensitivity
The KPFM signal-to-noise ratio is mirrored by the magnitude of the electrostatic interaction or amplitude sensitivity of Electrostatic Force Microscopy (EFM). The greater the EFM amplitude sensitivity, the higher the response of the KPFM signal-to-noise ratio can be.
The EFM amplitude sensitivity can be established as ΔEFM amplitude/Δ tip bias. When the cantilever’s resonance frequency and the electrical driving frequency are equal, the EFM amplitude can be defined as:
 |
(3) |
Where the amplitude of the cantilever displacement is marked as X; Q is the cantilever’s Q factor, and ‘k’ is the cantilever’s spring constant. Thus, the proportions of EFM amplitude correspond directly to the VAC while being in opposition to the proportions of cantilever’s spring constant.
An additional factor that impacts the EFM amplitude sensitivity is the photo detector’s laser displacement (Δa) [4]. It is evaluated as:
 |
(4) |
Where Lx is the distance between the tip and the cantilever, Lc is the length of the cantilever length and ΔZ the oscillation displacement of the cantilever. Thus, there is a smaller displacement when the cantilever appears longer.
There is an increase in EFM amplitude sensitivity when the cantilever has a short length and/or a small spring constant, thereby increasing the KPFM signal sensitivity [4].
F14H20
KPFM not only determines the CPD on metals or semiconductors but can also measure the surface potential of soft or organic samples like the molecules of some self-assembled alkanes.
Eicosylperfluorotetradecane, F(CF2)14(CH2)20H, or its abbreviated form F14H20, is a semi-fluorinated alkane with a chain segment that is perfluorinated. It is comprised of two incompatible subunits that separate into specific domains.
The discord in the cross-section between the perfluoro and the perhydro alkyl tail leads to unusual superstructure formations (Figure 4). The mechanism on how these compounds are ordered in specific polymorphism is still to be fully comprehended. The evaluation of semi-fluorinated alkanes, such as F14H20, advances self-assembly knowledge [5].
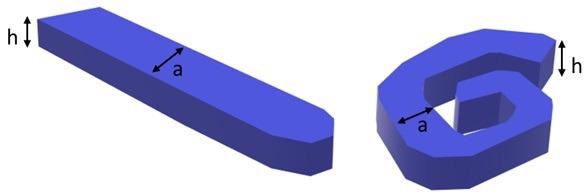
Figure 4. Schematic pictures of the ribbon and the spiral morphology for F14H20. Image Credit: Park Systems
Experimental
In this study, a Park NX10 AFM system, fitted with SmartScanTM software, quantifies the local contact potential difference and topography of F14H20 molecular structures. The study exhibits a contrast between Sideband KPFM and traditional off-resonance KPFM image resolution.
For the Sideband KPFM experiments, lock-in amplifiers transmit a 3 kHz AC signal to the cantilever, while the conventional technique utilizes a 17 kHz AC signal. The phase and amplitude of the resonances are automatically selected by SmartScanTM.
Throughout the experiments, the mean signal of both sidebands was recorded. Two distinct types of conductive cantilevers, NSC14/Cr-Au and NSC36-C/Cr-Au, are employed for the correlation analysis between EFM amplitude sensitivity, as well as the analysis of the cantilever’s length, and the spring constant.
NSC14/Cr-Au and NSC36-C/Cr-Au are 125 and 130 μm long, respectively and have a spring constant of 5 and 0.6 N/m each.
Figure 5 displays a comparison in surface potential between Sideband and traditional off-KPFM images acquired using a NSC36-C/Cr-Au cantilever.
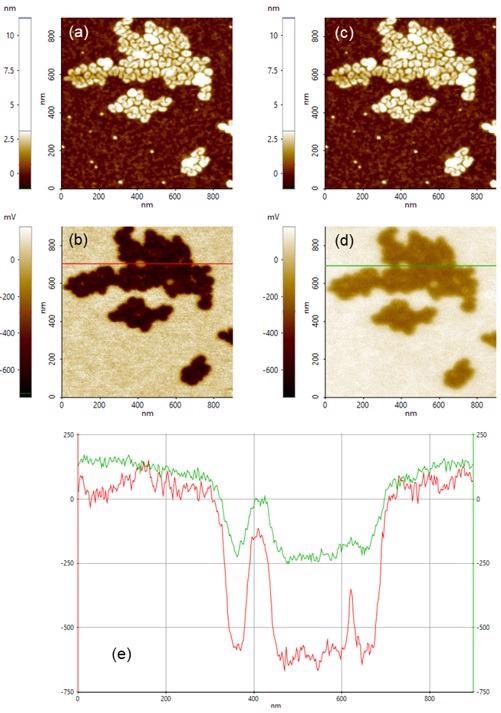
Figure 5. Sideband and Off-resonance comparison. (a) Sideband topography image. (b) Sideband surface potential image. (c) Off-resonance topography image. (d) Off-resonance surface potential image. (e) Line profiles taken along red line in (b) and along green line in (d). Image Credit: Park Systems
The Sideband KPFM measurement of the F14H20 aggregates demonstrates a surface potential contrast of 600-650 mV between the fluorinated parts of the substrate and the molecules, along with a distinct lateral resolution where even space in-between the aggregates is determined.
Observing the traditional off-resonance KPFM measurements, the image illustrates that the technique measures the possible difference of the aggregates and the substrate successfully. However, this potential difference produces a value of 300 mV.
The spatial resolution is not as well-defined. The enhanced resolution when employing the use of the Sideband mode is dependent on the local interaction between the tip apex and sample.
The topography images suggest that the F14H20 aggregates of this sample generate an incomplete spiral superstructure (Figure 5). These incomplete spirals typically give rise to more compacted superstructures, limiting the in-between spaces of the aggregates [5].

Figure 6. Surface Potential Difference of F14H20 via Sideband KPFM. (a) Surface Potential imaged with probeNSC14/Cr-Au. (b) Surface Potential imaged with probe NSC36C/Cr-Au. (c) Line profiles taken along redline in (a) and green line in (b). Image Credit: Park Systems
The results of the association between the spring constant of the cantilever and KPFM signal-to-noise ratio sensitivity are shown in Figure 6. Cantilever NSC36-C/Cr-Au (Figure 6b) demonstrated a greater sensitivity for the changes in surface potential than the cantilever NSC14/Cr-Au (Figure 6a).
Line profiles extracted from both images, displayed in Figures 6a and 6b, reveal that Sideband KPFM can detect small changes on the surface potential, even in-between the F14H20 superstructures, by using both types of cantilever tip.
The fact that NSC36-C/Cr-Au demonstrates a greater KPFM signal sensitivity and has a spring constant that is nearly ten times smaller than NSC14/Cr-Au suggests an association between the spring constant of the probe and the sensitivity.
Equation 4 determined that the length of the cantilever is also key for EFM amplitude sensitivity; both lengths of the cantilevers are almost equal, so the connection between cantilever length and EFM sensitivity is not considered.
Additional experiments are necessary to evaluate the association between the cantilever's length, the KPFM signal sensitivity and the EFM amplitude.
Summary
Throughout this study, Sideband Kelvin Probe Force Microscopy on a Park NX10 atomic force microscope is employed to capture images of F14H20 molecular structures. This study confirms that Sideband KPFM as a method can measure the surface potential with greater sensitivity and spatial resolution in contrast to the traditional off-resonance KPFM techniques.
The results suggest an association between KPFM signal sensitivity and the cantilever spring constant and that a reduced spring constant of the cantilever generates greater sensitivity than stiffer cantilevers.
Additional evaluation is necessary to comprehend the connection between KPFM signal sensitivity and cantilever length.
References
- Park Systems Application Technology Center. A Comparative Study of Atomic Force Microscopy between AM-KPFM and Sideband KPFM, Principles and Applications,
https://parksystems.com/images/media/appnote/AppNote-61_sideband-KPFM_A-comparative-study.pdf
- H. Seo, D. Guo, and G. Jung, How to obtain sample potential data for KPFM measurement. Park Systems Corporation, https://parksystems.com/images/media/appnote/How-to-obtain-sample-potential-data-for-KPFM-measurement-18.pdf
- A. Cerreta, et al. Exploring the Potential of the Sideband KPFM Mode. Park Systems Webinar, https://parksystems.com/medias/nano-academy/webinars/115-webinars/1850-exploring-the-potential-of-the-sideband-kpfm-mode-april-9-2020
- T. Fukuma, et al. Development of low noise cantilever deflection sensor for multi environment frequency modulation atomic force microscopy. Review of Scientific Instruments, Vol 76, (2005): 1-8.
- A. Mourran, et al. Self-Assembly of the Perfluoroalkyl-Alkane F14H20 in Ultrathin Films. Langmuir, Vol 21, (2005): 2308-2316.

This information has been sourced, reviewed and adapted from materials provided by Park Systems.
For more information on this source, please visit Park Systems.