Authors
Florian Aubrit*, David Jacob, Sylvain Boj
* actually at Organic Polymers Chemistry Laboratory (LCPO), CNRS-University of Bordeaux, 33600 Pessac, France
Extensive analysis into fluorescent semiconductor nanoparticles, or quantum dots (QDs) as they are commonly known, is consistently expanding into a significant field of research.
Some of the potential diverse and varied applications range from audiovisual and biomedical imaging to photovoltaic development. Fields in which optical properties rely heavily on QD size (usually, ≤30 nm), a good grasp of characterizing their acute dimensions is key.
One technique that presents itself as well-suited to such characterization is Dynamic Light Scattering (DLS), as it is a process that enables a representative size measurement of small nanoparticles (NPs) in suspensions.
However, the QDs absorption properties can be difficult to measure for the range of typical DLS lasers. Therefore, this study presents a DLS set-up developed specifically for Cd-based QD size measurement as a way of bypassing such difficulties.
The measurement that takes place within the suspension vial to limit the toxic QD handling can be achieved by inserting a (NIR) 780-nanometers laser in the DLS apparatus. This enables accurate size determination of red-emitting QDs, even when their absorption band goes up to 650 nm.
The analysis of a green-emitting QD suspension shows that such a set-up can also be used for more classical DLS size measurements, even where the NP size is quite small (≃9 nm) compared to the NIR wavelength.
This study argues that extending the range of DLS is possible and has uses for fluorescent particles with distinct absorbance in the visible range, making it an encouraging characterization method for a fluorophore-based system, especially in the biomedical field.
1 Context
1.1 Quantum Dots (QDs)
Assembled from semiconductor materials (typically, transition metal selenides, sulfide, or tellurides such as CdSe, CdS, ZnS, CdTe), quantum dots (QDs) are nanocrystals that induce unique optical properties according to size1, 2.
At the nanoscale, quantum confinement is apparent in these particles. The result is a discretization of the energy levels as well as in the material’s luminescent traits. Principally, quantum dots display fluorescence in the visible range of light when excited with UV (Figures 1 and 2).
As the gap between the conduction and the valence bands depends on NP size, the wavelength of the light emitted is linked precisely to the size of the nanoparticle. This makes it possible to tune the emission by altering the QD size toward a particular wavelength.
The wavelength of the QD emission (i.e., the color of the light produced), will be associated with the size polydispersity in the suspension. Indeed, a specific wavelength will be generated by each class of size.
For an emission in the visible range of light, conventional Cd-based QDs tend to have a size range between 5 and 25 nm. Therefore, because of these properties, QDs make up a very interesting field of research, which can lead to a wide range of applications such as biomedical imagery, screen development, or even photovoltaic material.

Figure 1. Scheme of the fluorescence process in quantum dots. An exciton (electron/hole pair) is formed with the UV excitation and, during its recombination, produces light in the visible range.
1.2 Dynamic Light Scattering (DLS)
To obtain accurate information with regards to the NP size, Dynamic Light Scattering (DLS) is a method based on the measurement of the scattered light fluctuations through colloidal suspension3.
By way of an analysis of the Brownian motion of the particles, it is possible to acquire the NP diffusion coefficient (D) and, subsequently, the hydrodynamic diameter (d) of the NPs. This is by virtue of the Stokes-Einstein equation:
 |
(1) |
Where D is expressed in m2.s−1, k is the Boltzmann constant (in J.K−1), T is the medium temperature (in Kelvin), η is the medium viscosity (in J.s.m−3), and d is the diameter of the particle (in m).
Fluctuations of the scattered laser light intensity can be correlated with a DLS device with an exponential-like correlogram, whose decay rate can be related to the diffusion coefficient and the scattering angle at intervals of the collected beam direction and the incident laser beam direction.
Ongoing DLS analysis can then generate a value of spherical NP size, as well as a perception of the polydispersity in sizes for a given colloidal suspension. Therefore, the DLS technique has been identified as an adequate characterization method for NP size measurement, often associated with parallel imaging techniques, such as Electronic Microscopies (TEM, SEM).
While electronic microscopy can display NP shapes and sizes at the local scale, DLS provides a better indication of the NP size and size polydispersity over the whole suspension.
1.3 DLS for QD Size Measurement
DLS has demonstrated its value in the characterization of various nanosized species (metallic nanoparticles, vesicles, protein, and polymeric compounds). However, technical concerns arise regarding its use for QDs, despite the extensive advantages it could deliver in the characterization of such nanocrystals.
In the first approximation, where DLS is concerned, the light scattering cross-section is comparable to d6. This means the smaller the particle, the dimmer the signal tends to be.
Therefore, it can be a difficult task to detect the size of QDs, especially the smaller ones (2-10 nm), even more so if larger objects (such as aggregates) are present in the suspension.
Moreover, the high toxicity of Cd-based QDs must also be accounted for. The control of such species should be limited as much as possible for safety concerns.
The final issue is directly related to the QD optical properties; as they emit light in the visible range, they also bear a strong absorbance band that is dependent on the QD size. This band drifts towards higher wavelengths as the size increases.
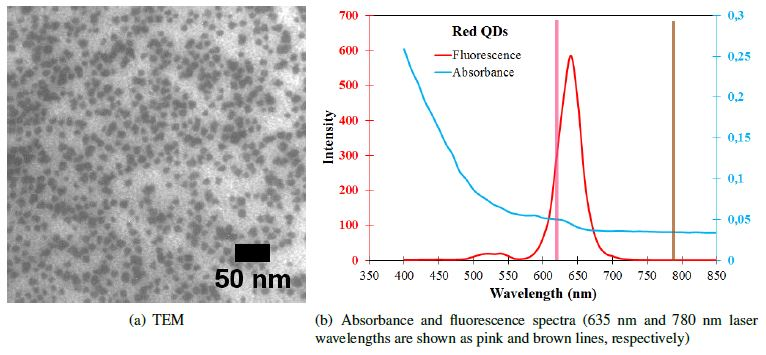
For example, in the case of red-emitting CdSe QDs (typical size around 15 nm), the absorbance band is based at around 600-650 nm, the conventional wavelength of a typical DLS laser (635 nm). A significant decrease in the recovered signal is then relative to this absorbance, and thus, leads to a difficult size measurement.
To overcome such complications, an unorthodox set-up based on the use of a Near-Infrared (NIR) laser in a DLS equipped with a remoted head is proposed as the core of our classical DLS experiment.
2 Experimental Protocol
2.1 Colloidal Suspensions
In this study, two batches of CdSe@CdS core/shell QDs have been analyzed. The first batch emits a glowing green-light fluorescence, while the second is emitting red-light (Figure 2). For continuity and descriptive purposes, these batches will be named “green QDs” and “red QDS,” respectively.

Figure 2. Pictures of both green- and red-emitting QDs suspensions in natural visible light and under UV exposition.
Each QD batch was initially supplied in powder form. Preparation of the QD suspensions (1 g/L) was achieved by dissolving the powders in toluene. Sonication (10 min, with an Emmi H22 sonicating bath; 120 W) was performed before DLS measurements were taken.
2.2 UV-visible and Fluorescence Spectroscopies
Analysis of the QD suspension absorbance and fluorescence bands was performed at Laboratoire de Chimie des Polymeres Organiques (LCPO) in Pessac, France, using a Spectra Max M2 from Molecular Devices.
2.3 Transmission Electronic Microscopy (TEM)
Using a LVEM-5 bench top TEM, TEM analysis was carried out at the laboratoire d’applications de Cordouan Technologies.
2.4 DLS Set-up
Dynamic Light Scattering measurements were taken with a Vasco KinTM apparatus, developed by Cordouan Technologies, using either the ‘conventional’ 635-nanometers laser diode or a 780 nanometers laser (NIR) for comparison.
Measurements were conducted at a scattering angle of 170 (back-scattering) using the in-situ head. The remote head (in situ head) enables DLS measurements to be taken within the confinement of the NP container without the need to relocate the species in a particular cell.
This, then, prevents the lengthy manipulation of the toxic Cd-based QDs. A repeated multimodal analysis algorithm (SBL), developed by Cordouan Technologies, has been utilized to assess the size of the QDs for which a series of notable features were provided regarding the relevancy of the measure and analysis.
The β parameter (0≤ β ≤ 1) was operating at an indication of the ratio signal/noise. The closer β is from 1, the more accurate the measure will be, but a β close to 0 is indicative of a strong noise in the signal, making the measurement more difficult to interpret.
Another feature concerning the quality of the fit analysis could be seen in the residues as they corresponded to the difference between the algorithm fitting curve and the correlogram acquired from the measure.
Smaller residues (arbitrarily, residues are said “good” when ≤ 0.01) made it more possible for the DLS to provide size values of improved value. With these tools, the prediction of the quality of DLS characterization was made possible.

Figure 3. Picture of the DLS set-up, with the Vasco Kin in situ head, for green QD size measurement.
3 Results
3.1 Green QDs
The initial sample analyzed with this DLS set-up was a suspension of green-emitting CdSe@CdS quantum dots in toluene. The average size of these particles was calculated using TEM, around 7 nm (Figure 4).

Figure 4. Green QDs characterization.
The absorbance band for this suspension comes in at 500 nm, which should not impede a classical DLS laser, and even less so with the 780-nanometers laser wavelength.
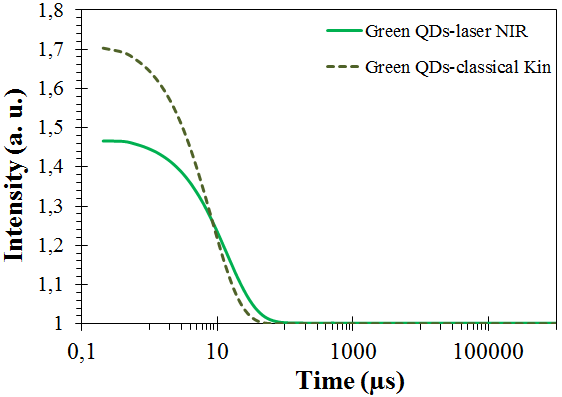
Figure 5 illustrates the correlogram recorded for the green QDs when analyzed with both 635-nanometers and 780- nanometers lasers. The Kin’s laser (635 nm) has an improved β, which was to be expected because the higher wavelength laser is likely to have a stronger noise.

Figure 5. DLS correlograms for the green QDs analysis, either with the classical 635-nanometers laser or the 780-nanometers laser.
Table 1. β and residues values for the DLS measurements on the green QDs suspension, made with both laser wavelengths.
| |
Laser 635 nm |
Laser 780 nm |
| β |
0.72 |
0.48 |
| Residues |
≤0.005 |
≤0.005 |
Table 1 compiles the value of there β values, as well as the residues values. Early on, it is noticeable that the measurements made by DLS, regardless of the laser wavelength and the algorithm fits, are relevant because the residues are very small (≤0.007).
Size distribution analysis made with the 635-nanometers laser and the 780-nanometers laser (Figure 6) displays similar results. It can be noted that a difference of 4 nm can be established with the TEM size measurements.

Figure 6. DLS size distribution of the green QDs either with the classical 635-nanometers laser or the 780-nanometers laser.
Table 2. DLS size measurements for the green QDs for both laser wavelengths.
| Intensity |
Laser 635 nm |
Laser 780 nm |
| QD size |
11.7 nm |
11.2 nm |
The stabilizing agents surrounding the NPs are the cause of the difference of a few nanometers. Therefore, with a thickness of up to 6 nm in diameter, such ligands can form a surface layer around the NPs4.
3.2 Red QDs
The same NIR-laser DLS technique was used to investigate larger red-emitting QDs. Due to their increased size, seen in TEM at around 12 nm, they become easier to detect as their absorbance band (600-650 nm) is now in the usual DLS laser wavelength (Figure 7).

Figure 7. Red QDs characterization.
By using a higher wavelength, it is possible to prevent any absorption of the laser. Moreover, the NIR-laser is a solution adapted to tackle absorption issues even though the collected signal remains noisy.
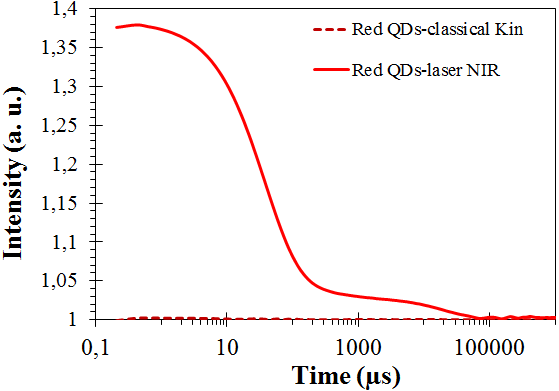
Figure 8 shows the correlograms acquired with both types of laser. The β values (shown in Table 3) show that the 635-nanometers laser is of no use for the analysis of QDs due to the high-noise issues.

Figure 8. DLS correlograms for the red QDs analysis, either with the classical 635-nanometers laser or the 780-nanometers laser.
Table 3. β and residues values for the DLS measurements on the red QDS suspension, made with both laser wavelengths.
| |
Laser 635 nm |
Laser 780 nm |
| β |
0.01 |
0.38 |
| Residues |
// |
≤0.005 |
However, the 780-nanometers laser can generate a proper correlogram with a β at an acceptable value, which can be later be analyzed for size measurement. No appropriate fit can be obtained via the measurements taken with the 635-nanometers laser.
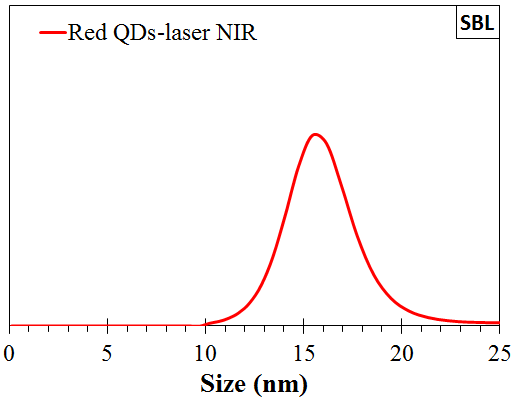
This tendency is confirmed by the residues for both algorithms and underlines the importance of the measurement done with the NIR laser. The various size distributions marked by intensity for both lasers are shown in Figure 9.

Figure 9. DLS size distribution of the red QDs with the 780-nanometers laser.
Table 4. DLS size measurements for the red QDs for both laser wavelengths.
| Intensity |
Laser 635 nm |
Laser 780 nm |
| QD size |
// |
15.4 nm |
While size values with the 365-nanometers laser measurement (Table 4) could not be recovered, those made with the 780-nanometers laser lead to a QD size of 15 nm. This was close to the size values obtained using TEM measurement, especially when taking into account the probable ligand layer surrounding the nanocrystals.
4 Conclusion
Conclusively, it has been made apparent that the NIR-laser can be a valuable asset in the DLS measurement of Cd-based QDs. Utilizing a laser with a wavelength set at 780 nm inhibits most of the absorption effects in the case of red-emitting QDs.
Indeed, in order to get a strong signal for size-retrieving, an algorithm that has been adapted for such a system proves to be useful. Although the values given by DLS remain larger than those witnessed in TEM (difference attributed to an organic layer of stabilizing agents, not seen in the TEM), the same characteristic QD sizes can be retrieved.
The comparison with the green-emitting QDs demonstrates that the DLS is already an effective instrument for characterizing small objects (≤10 nm), such as nanocrystals. Furthermore, the addition of the NIR laser can extend its potential for absorbing materials.
With the careful set-up of the NanoKinTM device, which has a remoted head and a direct in situ measurement inside the sample-containing vial, it has proven to be a powerful tool for restricting the handling of toxic materials.
While this study makes the first nascent steps in the DLS characterization of fluorescent nanoparticles, the same methodology has since been applied on red-emitting gold nanoclusters (3 nm in size), with very promising results.
The later results ensure the long-lasting viability of this characterization technique and enhance the potential for DLS. Some of the prospective applications include bio-medical imagery/treatments, and the characterization of strong visible-absorbing particles such as plasmonic NPs or various dyes/fluorophores used in the biological field.
References and Further Reading
- C. B. Murray, C. R. Kagan, and M. G. Bawendi. Synthesis and Characterization of Monodisperse Nanocrystals and Close-Packed Nanocrystal Assemblies. Annual Review of Materials Research, 30(1):545–610, 2000.
- M. Nasilowski, P. Spinicelli, G. Patriarche, and B. Dubertret. Gradient CdSe/CdS Quantum Dots with Room Temperature Biexciton Unity Quantum Yield. Nano Letters, 15(6):3953–3958, 2015.
- B. J. Berne and R. Pecora. Dynamic Light Scattering. Willey, New York, 2nd edition – 2000.
- F. Aubrit. Films nanocomposites plasmoniques auto-assembles´ . PhD thesis, Universite de Bordeaux, 2017.

This information has been sourced, reviewed and adapted from materials provided by Cordouan Technologies.
For more information on this source, please visit Cordouan Technologies.