Authors
Olivier Sandre, Florian Aubrit, Benoit Maxit, David Jacob and Sylvain Boj.
Anisotropic nanoparticles (NP), including nanodiscs, nanorods, nanotubes, etc., are used extensively in fields like medicine (fluorescent enhancers, tumor markers and light receptors), electronics (molecular electronic devices, sources of local heating) and a number of others.1
Self-assemblies of these NPs are also applied in the manufacture of advanced materials2 in which the size and shape of anisotropic NPs have a significant impact on their properties and, as a consequence, have an influence on their efficiency in the final application.
Consequently, being able to fully comprehend NP geometrical dimensions (aspect ratio, length, diameter) at various stages of their synthesis and application is crucial. These days, Transmission Electron Microscopy (TEM) is one of the most frequently used direct techniques for analyzing NP dimension and shape characteristics.
However, such a method requires a series of complicated sample preparation steps and a long observation time, which impedes the possibility of using it as a regular characterization technique.
The representativeness of sizes and shapes distributions evaluation is also statistically questionable since observation is acquired on a limited number of particles deposited on the TEM grid.
In such instances, indirect optical methods like Dynamic Light Scattering (DLS) measurement can bypass such limitations with some essential benefits: ease of use, limited sample preparation (direct measurement in liquid suspensions), short measurement time (data acquisition and processing in under a minute), robust statistical representativeness of the results (the scattered light beams probing trillions of NPs at once), etc.
However, conventional DLS analysis presupposes that particles are spherical and thus can only supply information on an average hydrodynamic diameter i.e., the effective diameter of a sphere with the equivocal translational coefficient as the NPs.
In the case of anisotropic nanoparticles, a refined version of DLS named Depolarized Dynamic Light Scattering (DDLS) can be used, which enables size and shape characterization of extremely small particles (down to a few nanometers).3
This article demonstrates the measurement abilities of a new and patented commercial DDLS system designed by Cordouan technologies (named Thetis)4 by communicating experimental results on small gold nanorods. The DDLS results contrast with TEM ones to qualify the precision of the measurements using this method.
DDLS Principle
A conventional DLS system facilitates the determination of NP diameter via the measurement of their diffusion behavior (Brownian motion) by tracking – at a given observation angle – the variations of the light scattered by the NP suspensions.
More accurately, the Auto Correlation Function (ACF) calculated from the light intensity variations provides access to a translational diffusion coefficient (Dt) which can be related to the hydrodynamic radius1 of the particle by the well-known Stokes-Einstein equation.5,6
In the application of anisotropic particles, their dynamics in the liquid are heavily influenced by their size and shape and are made up of both translational and rotational random motions, respectively detailed as a rotational diffusion coefficient (Dr) and a translation diffusion coefficient (Dt).
Applying the properties of linearly polarized light, it is then possible to measure Dt and Dr to ascertain the size and aspect ratio of the anisotropic particles.7
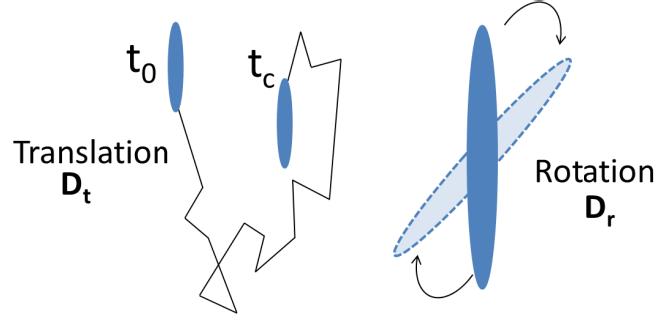
Figure1. Illustration of the Brownian motion of anisotropic particles where translational diffusion coefficient (Dt) and rotational diffusion coefficient (Dr) are its main characteristics. Image Credit: Cordouan Technologies
Figure 2 demonstrates the optical setup of Cordouan Technologies’ Thetis® DDLS instrument. First, the sample is directly exposed to a vertically polarized incident laser beam. Using a compact, motorized goniometer, scattered light is then acquired at various angles (θ).
The use of a high quality (GlanThomson) biprism facilitates splitting the scattered beam toward two specific detection channels in accordance with the light polarization, facilitating separate measurements of the vertically polarized (v-v) and the horizontally depolarized (v-h) scattered light with an extremely low optical cross-talk (<-35 dB) between the two polarization channels.

Figure 2. Scheme of the DDLS instrument optical setup. Image Credit: Cordouan Technologies
Where the anisotropic particles are concerned, the v-v and v-h detection channels lead to two distinct ACFs calculated from the corresponding scattered intensity fluctuations, respectively Gvv(τ) and Gvh(τ) shown in equations 1 and 2 below:
|
Gvv (τ) = A1 exp-(Γt + Γr) + A2exp-(Γt)τ + B
|
eq. 1 |
| GVH (τ) = A3exp -(Γt + Γr)T + B’ |
eq. 2 |
where τ represents the delay time of ACF, A1, A2 and A3 are weighting factors and B and B’ are background constants. One can ascertain that both ACFs are comprised of a “mixed mode” which combines the translational decay rate Γt and the rotational decay rate Γr. These decay rates relate to their corresponding diffusion coefficients using the following equations:
Where q represents the scattering wave vector characterized as  with n the suspension refractive index, λ the laser wavelength, and θ the detection angle.
Thus, one way to distinguish Dt and Dr from DDLS measurements is by plotting the mixed mode (Γt + Γr), acquired either from Gvh or the fast Gvv relaxation, as a function of q2.
The linear regression calculated from the data should then possess a slope equal to Dt and its extrapolation at q = 0 equal to 6Dr (see fig.3). It can be noted that Dt can also be established by plotting the pure translational mode as acquired from the slow Gvv relaxation.
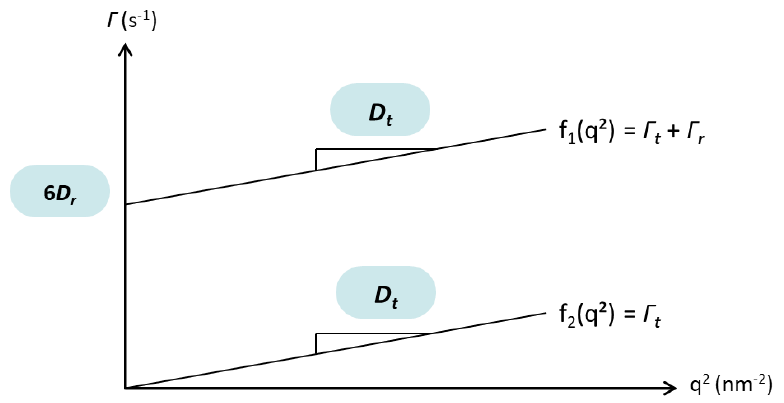
Figure 3. Graphical determination of the translational and rotational diffusion constants from the decay rates determined by fitting the autocorrelation functions Gvv(τ) and Gvh(τ) of scattered light intensity fluctuations in parallel (v-v) and in perpendicular (v-h) polarizations. Image Credit: Cordouan Technologies
The determination of two various diffusion coefficients enables two dimensions of anisotropic particles to be calculated, generally the length L and the aspect ratio L/w (where w is the width of particles which, in the case of cylinders, is their diameter. The width is obtained via a calculation of L and L/w).
Numerous hydrodynamic models can be applied in such calculations subject to the targeted shape of particles. For instance, in the case of straight cylinders, Dt and Dr can be established by applying the general equations 5 and 6.7
 |
eq. 5 |
 |
eq. 6 |
Where T represents temperature, kB stands for the Boltzmann constant, η the dynamic viscosity of the continuous phase, and is a  model-dependent function of the aspect ratio L/w.
All the results displayed in this study have been, more accurately, calculated by the application of the model of De La Torre et al., offering an effective numerical approximation of the  function for nanorods.8
Anisotropic Particles
To effectively evaluate the performance of the DDLS setup, three different suspensions of gold nanorods were assessed by DDLS. Synthesis of samples Au-NR1 and Au-NR2 were conducted using a protocol derived from the “Turkevitch” method, well described in literature,9,10,11 and this allows the effective control of particles shape.
This particular method suggests the use of Cetyl Trimethylammonium Bromide (CTAB) surfactants which align the particles growth towards anisotropic shape by inhibiting particular crystal facets' growth.
Several washing steps by centrifugation are carried out to prevent the undesirable occurrence of CTAB micelles; it should be noted that CTAB remains at the surface of particles after their growth.
The initial estimation of the size and aspect ratio of the NPs here was achieved from Transmission Electron Microscopy (TEM) micrographs via an LVEM5 bench microscope set at an acceleration voltage of 5 kV. The mean dimensions of nanorods as established from these observations (100 particles count) are displayed in Table 1.
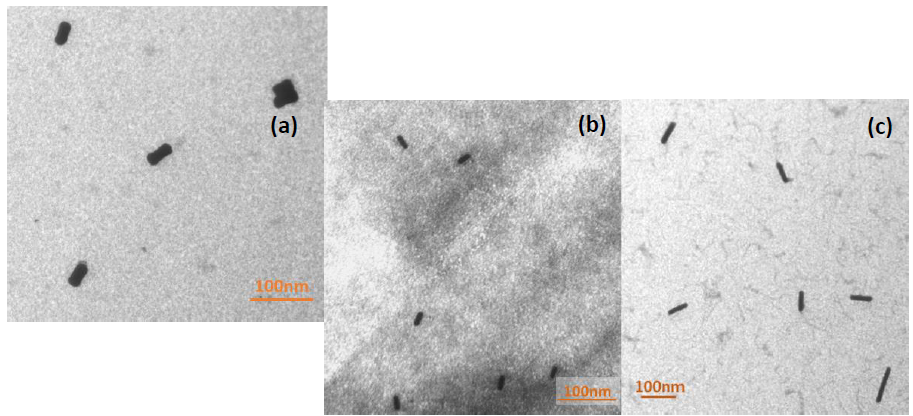
Figure 4. Electron micrographs of samples Au-NR1(a), Au-NR2(b) and Au-NR3(c). Image Credit: Cordouan Technologies
It should be noted that DDLS takes into account the hydrodynamic dimension of particles which includes the layers of surfactant adsorbed to their surface as well as the solvation layer.
To account for surfactants when comparing TEM and DDLS results, an approximation of the theoretical hydrodynamic sizes of Au-NR1 and Au-NR2 was performed by considering a CTAB bilayer thickness of 3.2 nm12 and by summing this value with the TEM measurements (see Table 1).
Sample Au-NR3 is a commercial product acquired from Company Nanocomposix (Product n° GRCN980 – lot n°ASP0002). The manufacturer supplies the average sizes as determined by TEM (JEOL 1010), also displayed in Table 1.
Stabilization of these particles is conducted using citrates, and their hydrodynamic sizes should be less than the CTAB bilayer. The average hydrodynamic diameter is established in accordance with the manufacturer’s standard. The value does not necessarily describe the nanorods correctly since it does not fully consider their anisotropic properties.
Table 1. Average dimensions of nanorods determined from TEM observations. In the case of Au-NR1 and Au-NR2, is also reported the sizes considering the CTAB bilayer thickness. Source: Cordouan Technologies
| |
Au-NR1 |
Au-NR2 |
Au-NR3 |
| by |
TEM sizes |
L |
41.5 ± 4.6 nm |
21.9 ± 2.3 nm |
59.9 ± 9.3 nm |
| w |
19.8 ± 3.6 nm |
8.1 ± 1.0 nm |
10.1 ± 1.2 nm |
| L/w |
2.1 |
2.7 |
6.0 |
| only |
Sizes with
CTAB bilayer |
L |
47.9 ± 4.6 nm |
28.3 ± 2.3 nm |
|
| w |
26.2 ± 3.6 nm |
14.5 ± 1.0 nm |
|
| L/w |
1.8 |
1.9 |
|
DDLS Measurements Results
DDLS was used to analyze the samples using the instrument Thetis®. In each case, measurements were conducted by changing the scattering angle from 30 to 150°, acquiring both v-h and v-h data.
An example of corresponding ACFs acquired at 7 scattering angles for sample Au-NR1 and normalized, respectively v-v ACFs in figure 5(a) and v-h ACFs in figure 5(b), are shown in figure 5. Figure 5(a) shows the angular dependency of the slow decay rate (corresponding to the exp[-Γt .τ] component of Gvv in eq 1).
This highlights the linear evolution of Γt upon q2 (see equation 3). Conversely, the rapid decay rate (relative to the exp[-(Γr +Γt).τ] mixed component of Gvv and Gvh in equations 1 and 2) demonstrates a lower change upon the angle of analysis.
This behavior can be explained by a greater value of Γr rate compared to Γt rate on the whole θ range and the fact that the rotational decay rate Γr is not contingent on q (see equation 4).
As the ratio of Dr and Dt correlates inversely to the length to the power 2 (see equations 5 and 6), the movement of the v-h ACV curves with the scattering angle would then be clearly visible for cylindrical NPs of much greater length.
Employing the SBL multimodal algorithm, the ProTheta® software is able to extract the decay rate values from each ACF and plot them as a function of q2. Figure 6 shows the graph drawn from the plotting of the (Γr +Γt) and Γt data of Gvv(τ) measurements for Au-NR1.
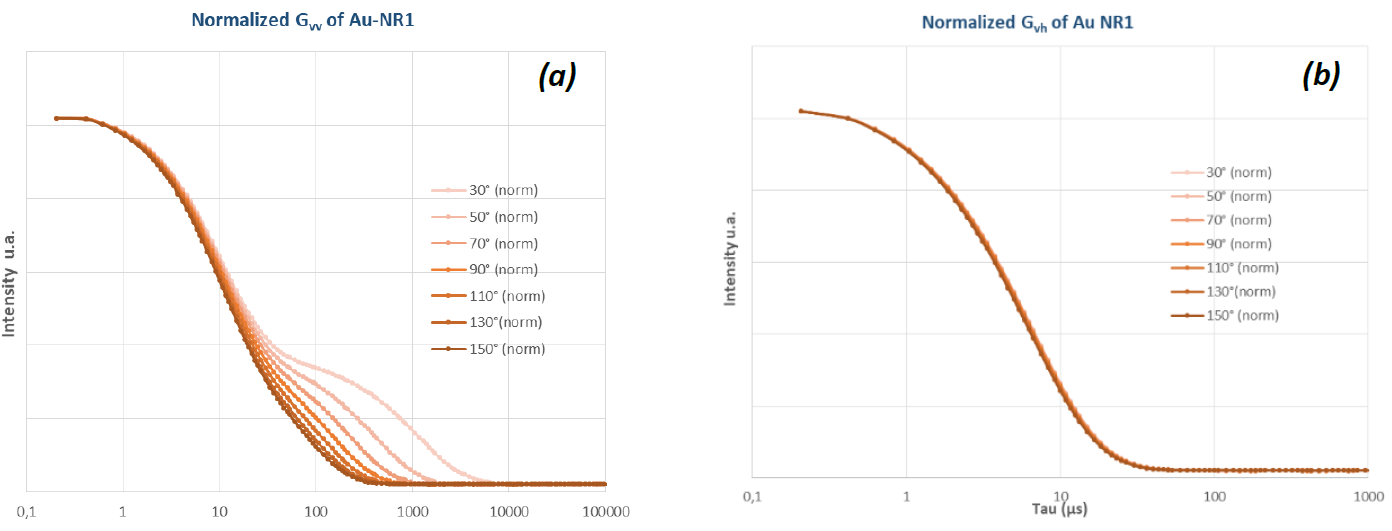
Figure 5. Autocorrelation functions measured for sample Au-NR1 at various scattering angles between 30 and 150°, from the respective scattered intensity fluctuations of (a) Ivv(t) and (b) Ivh(t). Image Credit: Cordouan Technologies
First, the decay rates measured were checked for Au-NR1, which behaved as expected for anisotropic particles. It was observed that the linear and parallel trend of decay rates upon q2 (Γr +Γt)(q2) could be extrapolated to a non-zero value when q tends towards 0, which is the sign of a rotational diffusion component.
As detailed in the measurement principles, the slope of the linear regressions enabled the determination of a translational diffusion coefficient and the extrapolation of (Γr +Γt)(q2) at q = 0, a rotational diffusion coefficient.
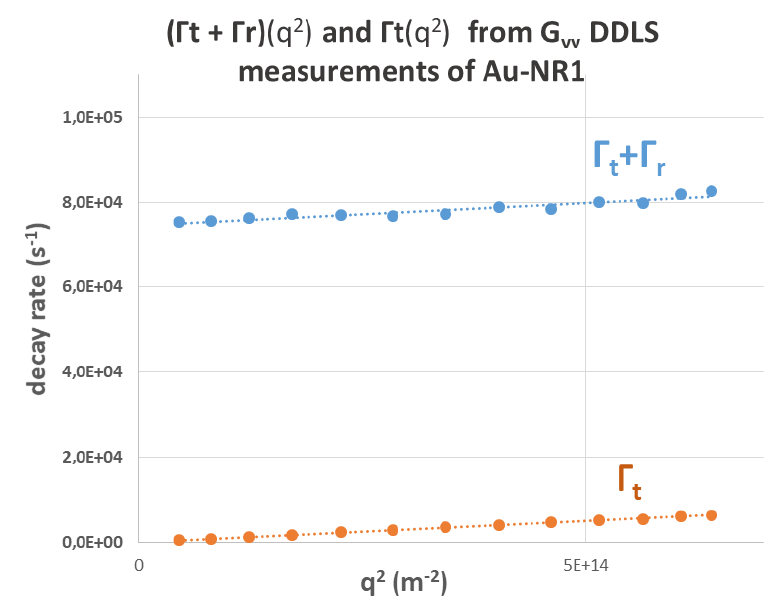
Figure 6. Decay rates determined by fitting the autocorrelation functions Gvv(τ) of Au-NR1 and plotted as a function of q2. Image Credit: Cordouan Technologies
In this particular instance, Dt = 9.93 106 nm2 s-1 and Dr = 1.24 104 s-1. Lastly, by way of applying the model of De La Torre et al. for cylindrical shapes,8 hydrodynamic dimensions of AuNR1 were derived from these diffusion coefficients at L = 46 nm and L/w = 1.38 (and thus, w = 34.8 nm).
The same method was applied to Au-NR2 and Au-NR3, and the results are displayed in Table 2 below:
Table 2. Diffusion coefficients and sizes of nanorods determined from the DDLS measurements and TEM observations. In case of Au-NR1 and Au-NR2, the TEM sizes are reported considering the CTAB bilayer thickness. Source: Cordouan Technologies
| |
Au-NR1 |
Au-NR2 |
Au-NR3 |
TEM sizes *+ CTAB
bilayer thickness |
L (nm) |
47.9 * |
28.3 * |
59.9 |
| w (nm) |
26.2 * |
14.5 * |
10.1 |
| L/w |
1.8 |
1.9 |
6.0 |
| DDLS measurement |
Dt (nm2.s-1) |
9.93 106 |
1.89 107 |
1.37 107 |
| Dr (s-1) |
1.24 104 |
7.19 104 |
1.37 104 |
| L (nm) |
46.0 |
28.3 |
70.7 |
| w (nm) |
34.8 |
16.9 |
14.2 |
| L/w |
1.3 |
1.7 |
5.0 |
Discussion
Table 2 demonstrates that the size measurements acquired by the application of DDLS are extremely consistent with what is expected from the TEM observations, therefore outlining the method’s relevance and robustness.
Specifically, it was demonstrated that both the length and the aspect ratio of small Au-NR2 nanorods can be determined accurately using the Thetis® DDLS setup.
However, two values deviate considerably from the TEM results: the aspect ratio of Au-NR1 acquired by DDLS was 1.3 rather than 1.8, which brings to the calculation of a larger rod hydrodynamic diameter and the length of Au-NR3, which is 18% more than than the mean TEM size.
In the case of Au-NR1 particles, it is apparent that the irregularity of their shape could be some of the primary reasons behind this result.
In actuality, TEM micrographs demonstrate that these rods are not completely cylindrical, and some of them possess a more rounded shape.
This could introduce an underestimation of the relative aspect ratios overall. It should be noted that with a L/w value of 1.7, the aspect ratio expected is theoretically less than the limit of validity of the hydrodynamic model used (defined for L/w ≥ 2),8 which, of course, may lead to some deviation of the experiment from the model description.
In the case of Au-NR3, the longer dimension was ascribed to the polydispersity in length of these commercial rods. The standard deviation of length measured by the manufacturer with TEM is 9.3 nm (1.2 nm for the diameter).
However, the mean results in DDLS (like in DLS) are weighted in scattered light intensity while they are weighted in the amount of particles by TEM counting method.
As larger particles were able to scatter much more light intensity than smaller ones, light scattering measurement shifts dimensions to larger sizes, in particular when the width of size distribution is large.
Finally, the solvation layer’s impact has not been considered for Au-NR3, and it is well known that it typically makes the hydrodynamic sizes of dense particles many nanometers larger than the TEM core sizes.
Conclusion
Application of the DDLS technique in a first industrial instrument offers a real and unique advantage for the development of new advanced materials. Here it is demonstrated that the results obtained for specific anisotropic nanoparticles are in accordance with TEM measurements.
DDLS is now established enough to be used at a large scale for all specific applications using anisotropic nanoparticles. Thetis can be viewed as a multiangle DLS and DDLS tool for all nanoparticle characterization possibilities.
References
- Reddy N.K. et al «Flow Dichroism as a Reliable Method To Measure the Hydrodynamic Aspect Ratio of Gold Nanoparticles», ACS Nano., 2011, V. 5. № 6, 4935−4944
- Sacanna S.; Pine D. J. “Shape-anisotropic colloids: Building blocks for complex assemblies” Current Opinion in Colloid & Interface Science, 2011, V. 16 (2), 96-105
- Turner, Leaf (1973). “Rayleigh-Gans-Born Light Scattering by Ensembles of Randomly Oriented Anisotropic Particles”. Applied Optics. 12 (5): 1085–1090
- F. Aubrit, D. Jacob, O. Sandre, “Device and method for determining characteristic parameters of the dimensions of nanoparticles”, Applicants: Cordouan Technologies, CNRS, Univ. Bordeaux, IPB. FR3100333 B1 (2021/09/17), EP3789750 A1 (2021/3/10), US11156540 B2 (2021/10/26). Priority date: 2019/09/03.https://www.cordouan-tech.com/thetis/
- Berne, B. J.; Pecora, R. Dynamic Light Scattering: WileyInterscience: New York, 1976.
- Zero, K.; Pecora, R. In Dynamic Light Scattering; Pecora, R., Ed.; Plenum Press: New York, 1985; p59
- Eimer W., Pecora R. J. Chem. Phys. 1991, 94, 2324-2329
- Garcia de la Torre, M. C. Lopez Martinez, and M. hl. Tirado, Biopolymers 23, 611 (1984).
- Turkevitch. Colloidal Gold. part I. Gold Bulletin, 18:86–91, 1985.
- Sau T K and Murphy C. J., Langmuir 20, 6414-6420 (2004).
- Scarabelli, A. Sánchez-Iglesias, J. Rérez-Juste, and L. M. Liz-Mán. A ”Tips and Tricks” Practical Guide to the Synthesis of Gold Nanorods. Journal of Chemistry Letters, 6:4270–4279, 2015
- Sergio Gómez-Graña 1 , Fabien Hubert, Fabienne Testard, Andrés Guerrero-Martínez, Isabelle Grillo, Luis M Liz-Marzán, Olivier Spalla Surfactant (bi)layers on gold nanorods, Langmuir. 2012 Jan 17;28(2):1453-9

This information has been sourced, reviewed and adapted from materials provided by Cordouan Technologies.
For more information on this source, please visit Cordouan Technologies.