Graphene is a two-dimensional carbon sheet composed of sp2 hybridized carbon atoms arranged in a regular hexagonal structure on an atomic scale. The remarkable mechanical properties of this material have piqued people’s interest.
Image Credit: unoL/Shutterstock.com
Most of those fascinating properties of graphene are preserved in graphene-based materials like graphene oxide (GO) and graphene nanoplatelets (GNP). Quantum physics, catalysis, nanocomposites, nanoelectronics, and sensor technology are just a few of the applications for graphene nanomaterials.
Due to their large surface area and delocalized π electrons, they can solubilize and adsorb drug molecules, with many attempts to use them for drug delivery or imaging. However, before doing so, the behavior of these materials in biological media must be established. Proteins are physically adsorbed onto the exterior of graphene oxide through non-covalent interactions.
Because of its large percentage of sequence identities (76%), in comparison to human serum albumin (HSA), high structural stability, and low cost, bovine serum albumin (BSA) is frequently used as a model protein. The high levels of growth stimulatory factors and low levels of growth-inhibitory factors make fetal bovine serum (FBS), whose chief component is BSA, the most extensively used growth supplement for cell cultures.
Some studies have considered the rheological properties of protein solutions, but there are concerns about maintaining the physiological medium’s viscosity. When graphene-based nanoparticles are added, viscosity changes occur, which can affect the structure of protein solutions.
However, there are no studies in the literature on the rheological behavior of graphene-related substances in biological media. In light of the foregoing, a structural and rheological analysis of the interaction of three graphene-based nanomaterials, namely graphene oxide (GO), expanded graphene oxide (EGO), and graphene nanoplatelets (GNP), with two different biological media, FBS and BSA, was carried out in this study.
Methodology
Biological fluids, bovine fetal serum (FBS) and bovine serum albumin (BSA), as well as graphene nanoplatelets (GNP) and graphene oxide (GO), were obtained.
The three graphenoids were dispersed in the biological fluid to make suspensions with concentrations of 1; 1.5; 2; and 3 mg/mL (Figure 1).
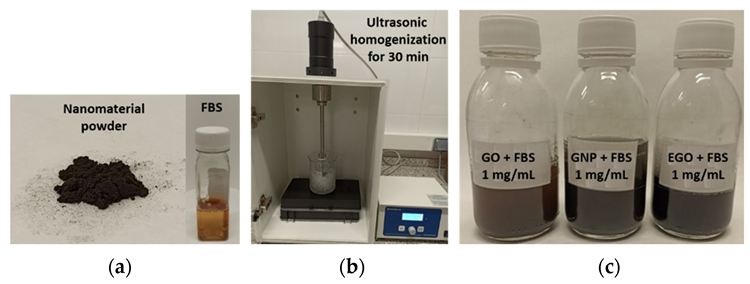
Figure 1. Photographs describing dispersions preparation. (a) Nanomaterial powder and FBS; (b) homogenization of samples and (c) dispersions obtained. Image Credit: Cerpa-Naranjo et al., 2022
The nanomaterials and the nanomaterials dispersed in biological fluids’ structural characterization were carried out with microscopy techniques: transmission electron microscopy (TEM), scanning electron microscopy (SEM), and atomic forces microscopy (AFM).
Microscopy techniques such as transmission electron microscopy (TEM), scanning electron microscopy (SEM), and atomic force microscopy were used to characterize the structural properties of nanomaterials and nanomaterials dispersed in biological fluids (AFM).
At neutral pH values, zeta potential measurements were taken with a Zetasizer Nano ZS instrument. A Haake RheoStress 6000 rotational rheometer was used to make the rheological measurements.
Various concentrations of GO, GNP, and EGO suspensions were measured. The rheological measurements at high shear rates were conducted in a rheometer with micrometric capillaries on a chip FluidicamRheo due to the constraints of rotational rheometry for low viscosities.
Results and Discussion
Microscopy techniques were used to characterize the structure. The images acquired by TEM are shown in Figure 2. The superposition of many layers can be seen in GO, the wrinkled surface with deformed edges owing to the formation of folds can be seen in GNP, and the superposition of several layers can be seen in EGO.

Figure 2. TEM images of the starting carbonaceous materials: (a) GO; (b) GNP; and (c) EGO powder. Image Credit: Cerpa-Naranjo et al., 2022
SEM was used to examine the morphology of the particles in greater detail. GO SEM images reveal a sheet-like structure with a smooth surface, illustrating that the layers of GO shrink when dispersed in FBS medium or water (Figure 3d, g). An equivalent morphology is noted in GNP and EGO powders, which are made up of random aggregates. It has been shown that when a nanomaterial comes into contact with a protein solution, its toxicity decreases.
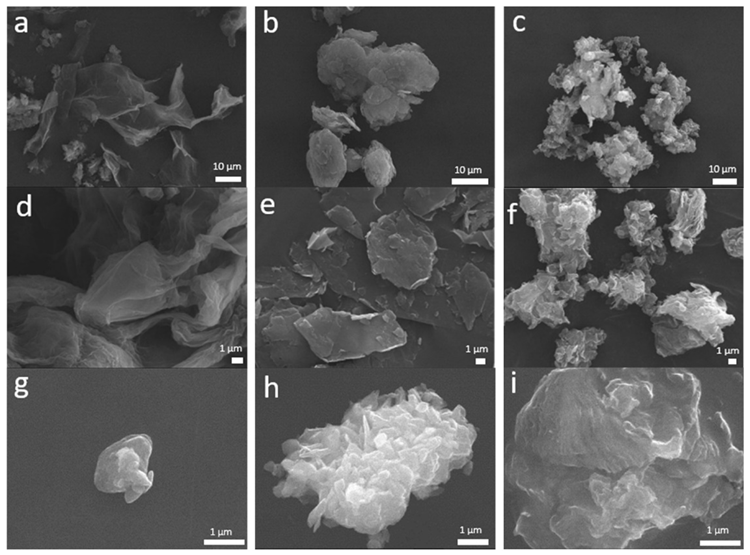
Figure 3. SEM images of GO, GNP and EGO starting powders (a, b, c, respectively) and the same powders dispersed in water (d, e, f, respectively) and dispersed in FBS (g, h, i, respectively). Image Credit: Cerpa-Naranjo et al., 2022
Figure 4 shows the 2D and 3D AFM images of the three graphene-based nanomaterials and their morphologies after interaction with the FBS.
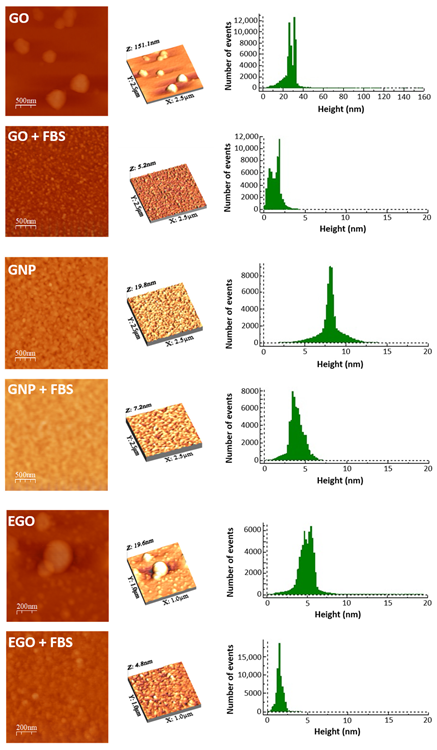
Figure 4. AFM 2D, 3D morphology and high profile of GO, GO + FBS, GNP, GNP + FBS, EGO and EGO + FBS. Image Credit: Cerpa-Naranjo et al., 2022
The stability of powders in suspension can be determined quantitatively using zeta potential measurements. The electrophoretic mobility values obtained after three distinct measurements for each sample are used to calculate zeta potentials.
Table 1 shows the average of these three measurements along with their standard deviations. The findings show that GO and EGO dispersions are more stable, whereas GNP dispersions have a higher tendency to aggregate.
Table 1. Zeta potential, mobility, and pH of GO; GNP; EGO suspended in FBS at 1 mg/mL and temperature 25 °C. Source: Cerpa-Naranjo et al., 2022
| Sample |
ZP |
Mobility |
pH |
| (mV) |
(μm·cm/V·s) |
|
| GO + FBS |
−25.7 ± 1.6 |
−2.0 ± 0.1 |
6.6 |
| GNP + FBS |
−18.1 ± 0.9 |
−1.4 ± 0.1 |
7.0 |
| EGO + FBS |
−26.6 ± 1.7 |
−2.1 ± 0.1 |
6.7 |
Figure 5 depicts the effect of various graphene-based nanomaterials on viscosity in the presence of biologic fluid and fetal bovine serum. The viscosity values for FBS alone and combined with the three nanomaterials are exceptionally low in all cases, indicating that the flow should be Newtonian. The samples were characterized using a rotational rheometer and a microfluidic chip rheometer to acquire a dependable rheological characterization.
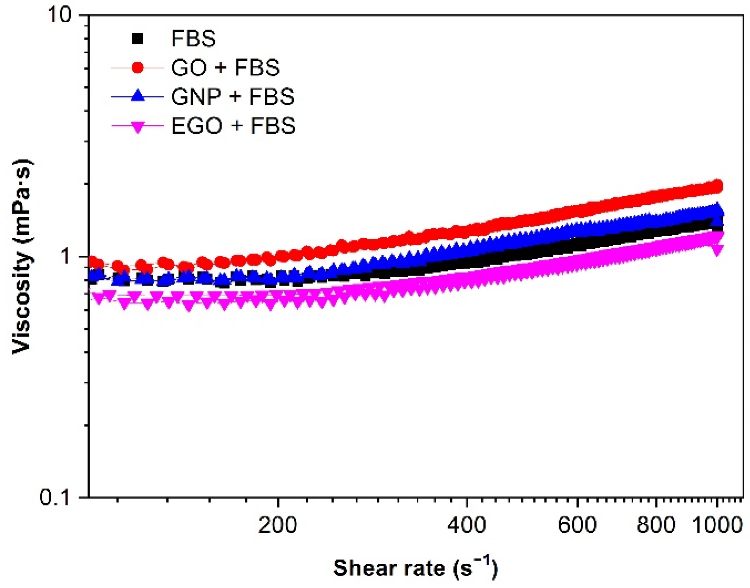
Figure 5. Viscosity (η) vs. shear rate (γ˙) for 1 mg/mL dispersions of FBS alone and different graphene-based nanomaterials with FBS biological medium. Temperature: 37 °C. Image Credit: Cerpa-Naranjo et al., 2022
The effect of nanomaterial concentration on viscosity was investigated by maintaining a constant temperature of 37 °C and a shear rate of 200 s−1. Figure 6 shows the viscosity curves collected for four different concentration dispersions. The EGO + FBS dispersion at 1 mg/mL has the lowest viscosity value of 0.6 mPa·s, while the GO + FBS dispersion at 3 mg/mL has the highest viscosity value of 1.3 mPa·s.
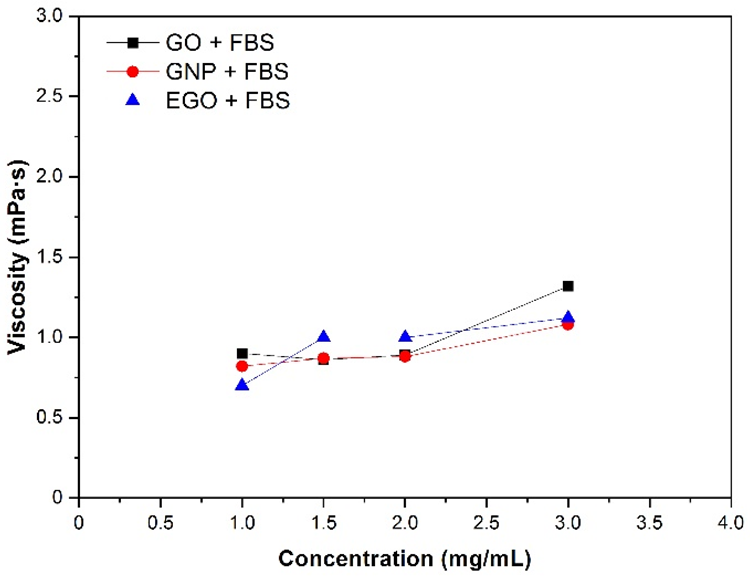
Figure 6. Viscosity of GO, GNP and EGO dispersed in FBS at different nanomaterial concentrations, temperature 37 °C and γ˙: 200 s−1. Image Credit: Cerpa-Naranjo et al., 2022
The study was supplemented with several measurements of viscosity in other fluids, like water and BSA, to better understand the behavior of nanomaterial dispersions in biological fluids other than FBS. The rotational rheometer was used to measure the viscosity of GNP, GO, and EGO dispersed in the three fluids studied (bovine serum albumin, fetal bovine serum, and water) at 1 mg/mL concentration.
Figure 7 depicts the viscosity values for the three fluids for the analyzed samples at 37 °C. The viscosity of the nanomaterials GO and GNP is higher in the presence of FBS; however, the viscosity of EGO is nearly identical in the presence of all three fluids.
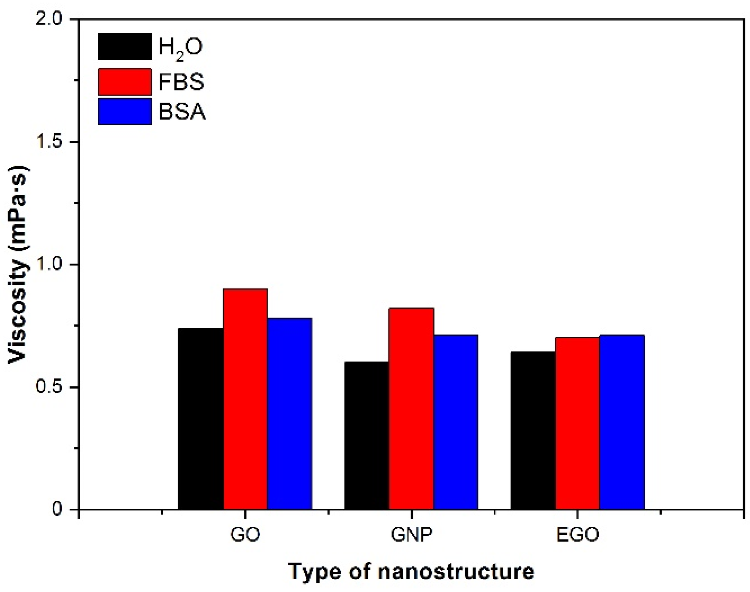
Figure 7. Viscosity values for dispersions of different nanostructures in several fluids. Concentration: 1 mg/mL; temperature 37 °C, γ˙: 200 s−1. Image Credit: Cerpa-Naranjo et al., 2022
Figure 8 and Table 2 show the effect of temperature on the viscosity of GO, EGO, and GNP, dispersed in FBS at a concentration of 1 mg/mL. All measurements were made with the two rheometers (rotational and microchip fluid) to find out the differences in viscosity of the three samples analyzed. For low viscous Newtonian fluids, the microfluidic chip rheometer proved to be more accurate.
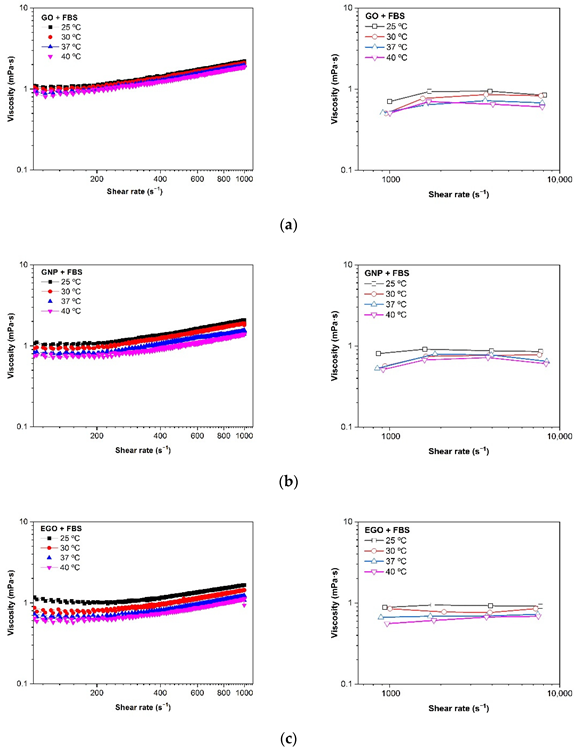
Figure 8. Viscosity (η) vs. shear rate (γ˙) at different temperatures of (a) GO + FBS, (b) GNP + FBS and (c) EGO + FBS at 1 mg/mL. Rotational rheometer (left) and microfluidic chip rheometer (right). Image Credit: Cerpa-Naranjo et al., 2022
Table 2. Viscosity values (mPa·s) of GO; EGO, GNP suspended in FBS at 1 mg/mL in rotational rheometer and Fluidicam equipments. Source: Image Credit: Cerpa-Naranjo et al., 2022
| |
|
|
Viscosity (mPa·s) |
| Sample |
Rheometer |
Shear Rate (s−1) |
25 °C |
30 °C |
37 °C |
40 °C |
| FBS |
Fluidicam |
1000–10,000 |
1.5 |
1.3 |
1.1 |
1.0 |
| Rotational |
200 |
1.8 |
1.5 |
1.4 |
1.3 |
| GO + FBS |
Fluidicam |
1000–10,000 |
0.8 |
0.8 |
0.6 |
0.6 |
| Rotational |
200 |
1.1 |
1.0 |
0.9 |
0.8 |
| GNP + FBS |
Fluidicam |
1000–10,000 |
0.9 |
0.7 |
0.7 |
0.6 |
| Rotational |
200 |
1.0 |
1.0 |
0.8 |
0.8 |
| EGO + FBS |
Fluidicam |
1000–10,000 |
0.9 |
0.8 |
0.7 |
0.7 |
| Rotational |
200 |
1.0 |
0.8 |
0.7 |
0.6 |
At low shear rates, the viscosity values measured in the rotational rheometer are a little higher than that observed at higher shear rates using a microfluidic chip. The viscosity values for the GNP + FBS, GO + FBS, and EGO + FBS dispersions in the temperature range of 25–40 °C are between 1.1 and 0.6 mPa·s.
When fetal bovine serum is being used as the dispersion medium, it can be seen that the type of graphene-based structure has no effect on the viscosity. Figure 9 depicts the effect of temperature on viscosity measurements in both rheometers. It has been demonstrated that as temperature rises, viscosity decreases.
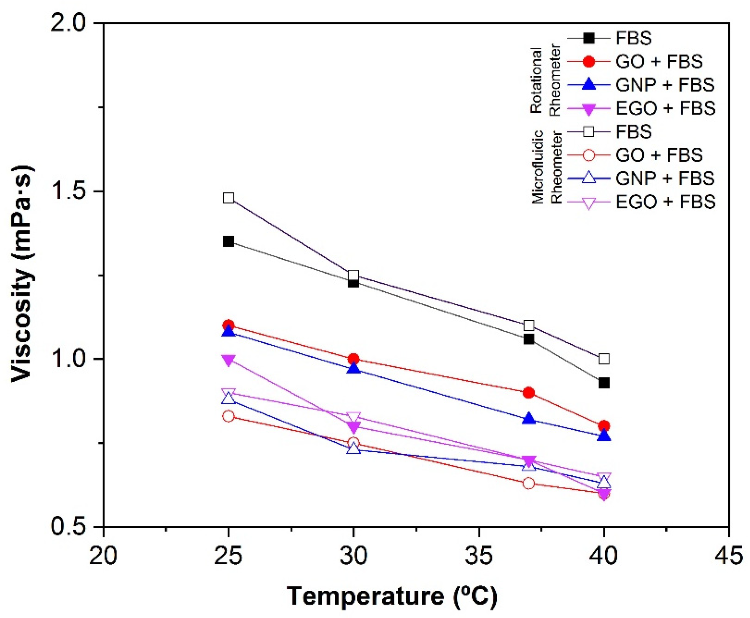
Figure 9. Effect of the temperature on the viscosity of GO + FBS, GNP + FBS and EGO + FBS at 1 mg/mL comparing rotational rheometer and microfluidic rheometer (Fluidicam). Image Credit: Cerpa-Naranjo et al., 2022
Conclusion
The current research analyzed the rheological behavior of dispersions of three graphenoid nanomaterials in biological fluids. Variables like the kind of nanomaterial, type of fluid, concentration, and temperature were examined.
Journal Reference:
Cerpa-Naranjo, A., Pérez-Piñeiro, J., Navajas-Chocarro, P., Arce, M. P., Lado-Touriño, I., Barrios-Bermúdez, N., Moreno, R., Rojas-Cervantes, M. L. (2022) Rheological Properties of Different Graphene Nanomaterials in Biological Media. Materials, 15(10), p. 3593. Available Online: https://www.mdpi.com/1996-1944/15/10/3593/htm.
References and Further Reading
- Novoselov, K. S., et al.( 2004) Electric field effect in atomically thin carbon films. Science, 306, pp. 666–669. doi.org/10.1126/science.1102896.
- Yang, Y., et al. (2013) Graphene based materials for biomedical applications. Material Today, 16, pp. 365–373. doi.org/10.1016/j.mattod.2013.09.004.
- Mkhoyan, K. A., et al. (2009) Atomic and electronic structure of graphene-oxide. Nanoletters, 9, pp. 1058–1063. doi.org/10.1021/nl8034256.
- Zhang, L., et al. (2010) Functional graphene oxide as a nanocarrier for controlled loading and targeted delivery of mixed anticancer drugs. Small, 6, pp. 537–544. doi.org/10.1002/smll.200901680.
- Yin, D., et al. (2013) Functional graphene oxide as a plasmid-based Stat3 siRNA carrier inhibits mouse malignant melanoma growth in vivo. Nanotechnology, 24, p. 105102.
- Bolibok, P., et al. (2021) A new approach to obtaining nano-sized graphene oxide for biomedical applications. Materials, 14, p. 1327. doi.org/10.3390/ma14061327.
- Matalkah, F & Soroushian, P (2020) Graphene nanoplatelet for enhancement the mechanical properties and durability characteristics of alkali activated binder. Construction and Building Materials, 249, 118773. doi.org/10.1016/j.conbuildmat.2020.118773.
- Cho, J., et al. (2020) Enhanced electrical conductivity of polymer nanocomposite based on edge-selectivity functionalized graphene nanoplatelets. Composites Science and Technology, 189, p. 108001. doi.org/10.1016/j.compscitech.2020.108001.
- Park, C. S., et al. (2016) Graphene-based nanoelectronic biosensors. Journal of Industrial and Engineering Chemistry, 38, pp. 13–22. doi.org/10.1016/j.jiec.2016.04.021.
- Kargar, S., et al. (2021) Ionic liquid modified graphene oxide supported Mo-complex: A novel, efficient and highly stable catalyst. Surfaces and Interfaces, 23, p. 100946. doi.org/10.1016/j.surfin.2021.100946.
- Liu, S., et al. (2011) Antibacterial activity of graphite, graphite oxide, graphene oxide, and reduced graphene oxide: Membrane and oxidative stress. ACS Nano, 5, pp. 6971–6980. doi.org/10.1021/nn202451x.
- Kuropka, P., et al. (2021) A Study of the Impact of Graphene Oxide on Viral Infection Related to A549 and TC28a2 Human Cell Lines. Materials, 14, p. 7788. doi.org/10.3390/ma14247788.
- Bhattacharya, K., et al. (2016) Biological interactions of carbon-based nanomaterials: From coronation to degradation. Nanomedicine: Nanotechnology, Biology and Medicine, 12, pp. 333–351. doi.org/10.1016/j.nano.2015.11.011.
- Chen, C., et al. (2022) Progress in the Development of Graphene-Based Biomaterials for Tissue Engineering and Regeneration. Materials, 15, p. 2164. doi.org/10.3390/ma15062164.
- Trusek, A & Kijak, E (2021) Drug Carriers Based on Graphene Oxide and Hydrogel: Opportunities and Challenges in Infection Control Tested by Amoxicillin Release. Materials, 14, p. 3182. doi.org/10.3390/ma14123182.
- Singh, D. P., et al. (2018) Graphene oxide: An efficient material and recent approach for biotechnological and biomedical applications. Materials Science and Engineering: C, 86, pp. 173–197. doi.org/10.1016/j.msec.2018.01.004.
- Kopac, T (2021) Protein corona, understanding the nanoparticle-protein interactions and future perspectives: A critical review. International Journal of Biological Macromolecules, 169, pp. 290–301. doi.org/10.1016/j.ijbiomac.2020.12.108.
- Sopotnik, M., et al. (2015) Comparative study of serum protein binding to three different carbon-based nanomaterials. Carbon, 95, pp. 560–572. doi.org/10.1016/j.carbon.2015.08.018.
- Mahmoudi, M., et al. (2011) Protein-nanoparticle interactions: Opportunities and challenges. Chemical Reviews, 111, pp. 5610–5637. doi.org/10.1021/cr100440g.
- Wu, Z., et al. (2009) Regulation of enzyme activity through interactions with nanoparticles. International Journal of Molecular Sciences, 10, pp. 4198–4209. doi.org/10.3390/ijms10104198.
- Sheng, A., et al. (2016) Impact of proteins on aggregation kinetics and adsorption ability of hematite nanoparticles in aqueous dispersions. Environmental Science & Technology, 50, pp. 2228–2235. doi.org/10.1021/acs.est.5b05298.
- Zhao, X., et al. (2017) Controlled pH-and glucose-responsive drug release behavior of cationic chitosan based nano-composite hydrogels by using graphene oxide as drug nanocarrier. Journal of Industrial and Engineering Chemistry, 49, pp. 36–45. doi.org/10.1016/j.jiec.2016.12.023.
- Wu, C., et al. (2014) Probing the protein conformation and adsorption behaviors in nanographene oxide-protein complexes. Journal of Nanoscience and Nanotechnology, 14, pp. 2591–2598. doi.org/10.1166/jnn.2014.8521.
- Moghassemi, S., et al. (2017) Formulation and Characterization of Bovine Serum Albumin-Loaded Niosome. AAPS PharmSciTech, 18, pp. 27–33. doi.org/10.1208/s12249-016-0487-1.
- Zheng, X., et al. (2006) Proteomic analysis for the assessment of different lots of fetal bovine serum as a raw material for cell culture. Part IV. Application of proteomics to the manufacture of biological drugs. Biotechnology Progress, 22, pp. 1294–1300. doi.org/10.1021/bp060121o.
- Punyiczki, M & Rosenberg, A (1992) The effect of viscosity on the accessibility of the single tryptophan in human serum albumin. Biophysical Chemistry, 42, pp. 93–100. doi.org/10.1016/0301-4622(92)80011-S.
- Zidar, M., et al. (2020) Control of viscosity in biopharmaceutical protein formulations. Journal of Colloid and Interface Science, 580, pp. 308–317. doi.org/10.1016/j.jcis.2020.06.105.
- Wonerow, T., et al. (2021) Rheologic Behavior of Bovine Calf Serum. Materials, 14, p. 2538. doi.org/10.3390/ma14102538.
- Vallejo, J. P., et al. (2018) Flow behaviour of suspensions of functionalized graphene nanoplatelets in propylene glycol–water mixtures. International Communications in Heat and Mass Transfer, 91, pp. 150–157. doi.org/10.1016/j.icheatmasstransfer.2017.12.001.
- Alyamac, E., et al. (2021) Stability, rheology, and thermophysical properties of surfactant free aqueous single-walled carbon nanotubes and graphene nanoplatelets nanofluids: A comparative study. Journal of Dispersion Science and Technology, pp. 1–10. doi.org/10.1080/01932691.2021.1947849.
- Cerpa, A., et al. (2019) Colloidal and rheological characterization of SWCNT in biological media. International Journal of Smart and Nano Materials, 10, pp. 300–315. doi.org/10.1080/19475411.2019.1694555.
- Cerpa, A., et al. (2021) Rheological behaviour of carbon nanotubes suspensions with biomedical applications. In Estudos em Biociencias e Biotecnologia, Chapter 2; Editora Artemis: Curitiba, Brazil, pp. 16–27. doi.org/10.37572/EdArt_2112215072.
- Lavin-Lopez, M. P., et al, A. Influence of the reduction strategy in the synthesis of reduced graphene oxide. Advanced Powder Technology, 28, pp. 3195–3203. doi.org/10.1016/j.apt.2017.09.032.
- Lee, S., et al. (2013) Large-scale production of high-quality reduced graphene oxide. Chemical Engineering Journal, 233, pp. 297–304. doi.org/10.1016/j.cej.2013.08.050.
- Cheong, Y. K., et al. (2020) Synergistic antifungal study of PEGylated graphene oxides and copper nanoparticles against Candida albicans. Nanomaterials, 10, p. 819. doi.org/10.3390/nano10050819.
- Franqui, L. S., et al. (2019) Interaction of graphene oxide with cell culture medium: Evaluating the fetal bovine serum protein corona formation towards in vitro nanotoxicity assessment and nanobiointeractions. Materials Science and Engineering: C, 100, pp. 363–377. doi.org/10.1016/j.msec.2019.02.066.
- Zhu, Y., et al. (2009) Effects of serum proteins on intracellular uptake and cytotoxicity of carbon nanoparticles. Carbon, 47, pp. 1351–1358. doi.org/10.1016/j.carbon.2009.01.026.
- Park, M., et al. (2017) MoS2-nanosheet/graphene-oxide composite hole injection layer in organic light-emitting diodes. Electronic Materials Letters, 13, pp. 344–350. doi.org/10.1007/s13391-017-1612-3.
- Palmieri, V., et al. (2018) Graphene oxide coatings prevent Candida albicans biofilm formation with a controlled release of curcumin-loaded nanocomposites. Nanomedicine, 13, pp. 2867–2879. doi.org/10.2217/nnm-2018-0183.
- Sapsford, K. E., et al. (2011) Analyzing nanomaterial bioconjugates: A review of current and emerging purification and characterization techniques. Analytical Chemistry, 83, pp. 4453–4488. doi.org/10.1021/ac200853a.
- Carnicer, V., et al. (2021) Microfluidic rheology: A new approach to measure viscosity of ceramic suspensions at extremely high shear rates. Open Ceram, 5, p. 100052. doi.org/10.1016/j.oceram.2020.100052.
- Raslan, A., et al. (2020) BSA- and Elastin-coated GO, but no collagen-coated GO, enhance the biological performance of alginate hydrogels. Pharmaceutics, 12, p. 543. doi.org/10.3390/pharmaceutics12060543.
- Gupta, S., et al. (2016) Microfluidic viscometers for shear rheology of complex fluids and biofluids. Biomicrofluidics, 10, p. 043402. doi.org/10.1063/1.4955123.
- Rothammer, B., et al. (2021) Rheological behavior of an artificial synovial fluid—Influence of temperature, shear rate and pressure. Journal of the Mechanical Behavior of Biomedical Materials, 115, p. s104278. doi.org/10.1016/j.jmbbm.2020.104278.
- Bortel, E., et al. (2015) Development of a Synthetic Synovial Fluid for Tribological Testing. Lubricants, 3, pp. 664–686. doi.org/10.3390/lubricants3040664.
- Mazzucco, D., et al. (2002) Rheology of joint fluid in total knee arthroplasty patients. Journal of Orthopaedic Research, 20, pp. 1157–1163. doi.org/10.1016/S0736-0266(02)00050-5.